
关于Prometheus监控不太了解的话可以参考

这里我们演示中,prometheus以及mysqld_exporter都使用容器进行运行。这里我的服务器配置为阿里云2h4g
由于Prometheus及相关的exporter会随着版本发生变化,官方推荐都是最新的版本。这里我为了保证后期文档可用性,将mysqld_exporter和node_exporter都传到我的仓库中,下面有直接下载的方法
Docker Install
安装docker版本使用19.06,使用脚本一键安装
19.03版本需要最新的Linux 5.x内核支持,如果达不到升级的条件可以使用18.09的版本,具体参考docker官方文章
export VERSION=19.03
curl -fsSL "https://get.docker.com/" | bash -s -- --mirror Aliyun
所有机器配置加速源并配置docker的启动参数使用systemd,使用systemd是官方的建议,详见 https://kubernetes.io/docs/setup/cri/
mkdir -p /etc/docker/
cat>/etc/docker/daemon.json<<EOF
{
  "exec-opts": ["native.cgroupdriver=systemd"],
  "registry-mirrors": [
      "https://fz5yth0r.mirror.aliyuncs.com",
      "https://dockerhub.mirrors.nwafu.edu.cn/",
      "https://mirror.ccs.tencentyun.com",
      "https://docker.mirrors.ustc.edu.cn/",
      "https://reg-mirror.qiniu.com",
      "http://hub-mirror.c.163.com/",
      "https://registry.docker-cn.com"
  ],
  "storage-driver": "overlay2",
  "storage-opts": [
    "overlay2.override_kernel_check=true"
  ],
  "log-driver": "json-file",
  "log-opts": {
    "max-size": "100m",
    "max-file": "3"
  }
}
EOF
启动docker,检查状态是否正常
systemctl enable --now docker
查看docker info
[root@abcdocker ~]# docker info
Client:
 Debug Mode: false

Server:
 Containers: 1
  Running: 0
  Paused: 0
  Stopped: 1
 Images: 2
 Server Version: 19.03.11
 Storage Driver: overlay2
  Backing Filesystem: extfs
  Supports d_type: true
  Native Overlay Diff: true
 Logging Driver: json-file
 Cgroup Driver: systemd
 Plugins:
  Volume: local
  Network: bridge host ipvlan macvlan null overlay
  Log: awslogs fluentd gcplogs gelf journald json-file local logentries splunk syslog
 Swarm: inactive
 Runtimes: runc
 Default Runtime: runc
 Init Binary: docker-init
 containerd version: 7ad184331fa3e55e52b890ea95e65ba581ae3429
 runc version: dc9208a3303feef5b3839f4323d9beb36df0a9dd
 init version: fec3683
 Security Options:
  seccomp
   Profile: default
 Kernel Version: 5.6.7-1.el7.elrepo.x86_64
 Operating System: CentOS Linux 7 (Core)
 OSType: linux
 Architecture: x86_64
 CPUs: 1
 Total Memory: 3.846GiB
 Name: abcdocker
 ID: 7NVC:4GYW:CRGD:ABOX:V6T4:LYEH:MLLO:UUB3:X5ZB:QTRC:A2RW:DER4
 Docker Root Dir: /var/lib/docker
 Debug Mode: false
 Registry: https://index.docker.io/v1/
 Labels:
 Experimental: false
 Insecure Registries:
  127.0.0.0/8
 Registry Mirrors:
  https://hjvrgh7a.mirror.aliyuncs.com/
 Live Restore Enabled: false
node_exporter 安装
node_exporter主要是用于监控宿主机的信息
项目地址https://github.com/prometheus/node_exporter
官方文档提示: node_exporter设计用于监控主机系统。不建议将其部署为Docker容器,因为它需要访问主机系统。请注意,您要监视的任何非根安装点都需要绑定到容器中。如果启动容器以进行主机监视,请指定path.rootfs参数。此参数必须与host root的bind-mount中的路径匹配。node_exporter将path.rootfs用作访问主机文件系统的前缀。
这里我们就不以容器进行运行,使用二进制安装的方式
官方下载地址https://prometheus.io/download/#node_exporter
#由于官方下载可能比较慢,我将压缩包上传到我的站点存储,本次演示的版本为1.0.0
wget http://down.i4t.com/prometheus/node_exporter-1.0.0.linux-amd64.tar.gz
tar xf node_exporter-1.0.0.linux-amd64.tar.gz
mkdir -p /usr/local/node_exporter
mv node_exporter /usr/local/node_exporter/node_exporter
创建systemd服务
#创建prometheus用户
[root@abcdocker local]# useradd -s /sbin/nologin -m prometheus
[root@abcdocker local]# id prometheus
uid=1002(prometheus) gid=1002(prometheus) groups=1002(prometheus)

cat >>/etc/systemd/system/node_exporter.service<<EOF
[Unit]
Description=node_exporter
After=network.target

[Service]
Type=simple
User=prometheus
ExecStart=/usr/local/node_exporter/node_exporter
Restart=on-failure

[Install]
WantedBy=multi-user.target
EOF
启动服务
在通过systemd启动之前我们先测试一下node_exporter是否正常,直接./usr/local/node_exporter/node_exporter运行成功即可
[root@abcdocker ~]# cd /usr/local/node_exporter/
[root@abcdocker node_exporter]# ./node_exporter
level=info ts=2020-06-08T15:56:43.206Z caller=node_exporter.go:177 msg="Starting node_exporter"
level=info ts=2020-06-08T15:56:43.207Z caller=node_exporter.go:112 collector=zfs
...
...
...
level=info ts=2020-06-08T15:56:43.207Z caller=node_exporter.go:191 msg="Listening on" address=:9100
level=info ts=2020-06-08T15:56:43.207Z caller=tls_config.go:170 msg="TLS is disabled and it cannot be enabled on the fly." http2=false

#直接执行没有问题,我们可以访问测一下。 需要单独在开通一个窗口进行curl,测试完毕以后通过ctrl -c结束node_exporter进程
[root@abcdocker node_exporter]# curl localhost:9100/metrics
# HELP go_gc_duration_seconds A summary of the pause duration of garbage collection cycles.
# TYPE go_gc_duration_seconds summary
go_gc_duration_seconds{quantile="0"} 0
...
go_memstats_alloc_bytes 1.256328e+06
#这里只要有数据即可
上面是执行二进制node_exporter是否异常,接下来我们就退出启动。通过systemd进行管理
systemctl daemon-reload
systemctl enable node_exporter
systemctl start node_exporter
systemctl status node_exporter

#温馨提示: 需要退出刚刚启动的进程,否则启动失败
到现在我们的node_exporter二进制已经安装完毕,如果想使用的可以使用下面的命令
docker run -d \
  --net="host" \
  --pid="host" \
  -v "/:/host:ro,rslave" \
  quay.io/prometheus/node-exporter \
  --path.rootfs=/host

#这里的命令为官方提供,官方建议使用二进制,docker安装参数查阅官方文档即可
https://github.com/prometheus/node_exporter/
mysqld_exporter安装
项目地址:https://github.com/prometheus/mysqld_exporter
目前mysqld_exporter支持的版本为
- MySQL> = 5.6
- MariaDB> = 10.1
为了方便管理,这里mysqld_exporter就是用docker进行运行,如果是使用二进制安装参数基本上相同
这里先到mysql授权mysqld_exporter用户,mysqld_exporter实际上是通过select 查看mysql状态获取metric
#登录mysql创建mysqld_exporter用户,docker安装就不要使用localhost
CREATE USER 'exporter'@'10.26.33.104' IDENTIFIED BY 'abcdocker..' WITH MAX_USER_CONNECTIONS 3;
GRANT PROCESS, REPLICATION CLIENT, SELECT ON *.* TO 'exporter'@'10.26.33.104';
FLUSH PRIVILEGES;

#查看exporter信息
MySQL [(none)]> select user,host from mysql.user;
+---------------+-----------+
| user          | host      |
+---------------+-----------+
| root          | 127.0.0.1 |
| exporter      | 10.26.33.104 |
+---------------+-----------+
9 rows in set (0.00 sec)
创建mysqld_exporter容器
docker run -d \
  --net="host" \
  --name mysqld_exporter \
  -e DATA_SOURCE_NAME="exporter:abcdocker..@(10.26.33.104:3306)/" \
  registry.cn-beijing.aliyuncs.com/abcdocker/mysqld_exporter:0.12.1

DATA_SOURCE_NAME exporter代表用户名:abcdocker代表密码(xxxx:3306 mysql授权地址)
查看容器启动状态
[root@abcdocker ~]# docker ps
CONTAINER ID        IMAGE                                                          COMMAND                  CREATED             STATUS              PORTS                    NAMES
e7ba8c43597e        registry.cn-beijing.aliyuncs.com/abcdocker/mysqld_exporter:0.12.1   "/bin/mysqld_exporter"   19 seconds ago      Up 18 seconds       0.0.0.0:9104->9104/tcp   nervous_tesla

#这里我们看到已经获取到metric
[root@abcdocker ~]# curl 10.26.33.104:9104/metrics
# HELP go_gc_duration_seconds A summary of the GC invocation durations.
# TYPE go_gc_duration_seconds summary
go_gc_duration_seconds{quantile="0"} 0
go_gc_duration_seconds{quantile="0.25"} 0
go_gc_duration_seconds{quantile="0.5"} 0
go_gc_duration_seconds{quantile="0.75"} 0
Prometheus Install
prometheus我们也安装在容器中
首先创建prometheus数据存储目录
[root@abcdocker ~]# mkdir /data/prometheus -p

#授权prometheus写入数据
[root@abcdocker ~]# chmod -R 777 /data/prometheus
接下来编辑prometheus配置文件
mkdir -p /etc/prometheus
cat >>/etc/prometheus/prometheus.yml <<EOF
global:
  scrape_interval:     20s   #表示prometheus抓取指标数据的频率,默认是15s,我们可以覆盖这个值
  evaluation_interval: 20s   #用来控制评估规则的频率,prometheus使用规则产生新的时间序列数据或者产生警报

scrape_configs:
  - job_name: prometheus
    static_configs:
      - targets: ['10.26.33.104:9090']  #mertics接口地址,相当于exporter地址
        labels:
          instance: prometheus
  - job_name: linux                #任务名称
    static_configs:
      - targets: ['10.26.33.104:9100']
        labels:
          instance: localhost
  - job_name: mysql
    static_configs:
      - targets: ['10.26.33.104:9104']
        labels:
          instance: localhost:3306
EOF


#targets的地址建议写内网IP,写localhost因为容器不通,localhost会让prometheus以为是自己的端口,造成不通信的问题
创建prometheus容器
docker run -d \
  -p 9090:9090 \
  --restart=always \
  --name prometheus \
  -v /data/prometheus:/data/prometheus \
  -v /etc/prometheus/prometheus.yml:/etc/prometheus/prometheus.yml \
  registry.cn-beijing.aliyuncs.com/abcdocker/prometheus:v2.18.1 \
  --config.file=/etc/prometheus/prometheus.yml \
  --storage.tsdb.path=/data/prometheus \      #数据存储目录
  --web.enable-admin-api \          #动态更新
  --web.enable-lifecycle \
  --storage.tsdb.retention.time=30d   #数据保留天数
查看prometheus容器状态
[root@abcdocker ~]# docker ps
CONTAINER ID        IMAGE                                                           COMMAND                  CREATED              STATUS              PORTS                    NAMES
08b7d3d2de18        registry.cn-beijing.aliyuncs.com/abcdocker/prometheus:v2.18.1   "/bin/prometheus --c…"   About a minute ago   Up 2 seconds        0.0.0.0:9090->9090/tcp   prometheus
e7ba8c43597e       registry.cn-beijing.aliyuncs.com/abcdocker/mysqld_exporter:0.12.1    "/bin/mysqld_exporter"   39 minutes ago       Up 39 minutes       0.0.0.0:9104->9104/tcp   nervous_tesla
[root@abcdocker ~]# docker logs 08b7d3d2de18
接下来我们就可以登录到宿主机IP+9090查看prometheus web ui
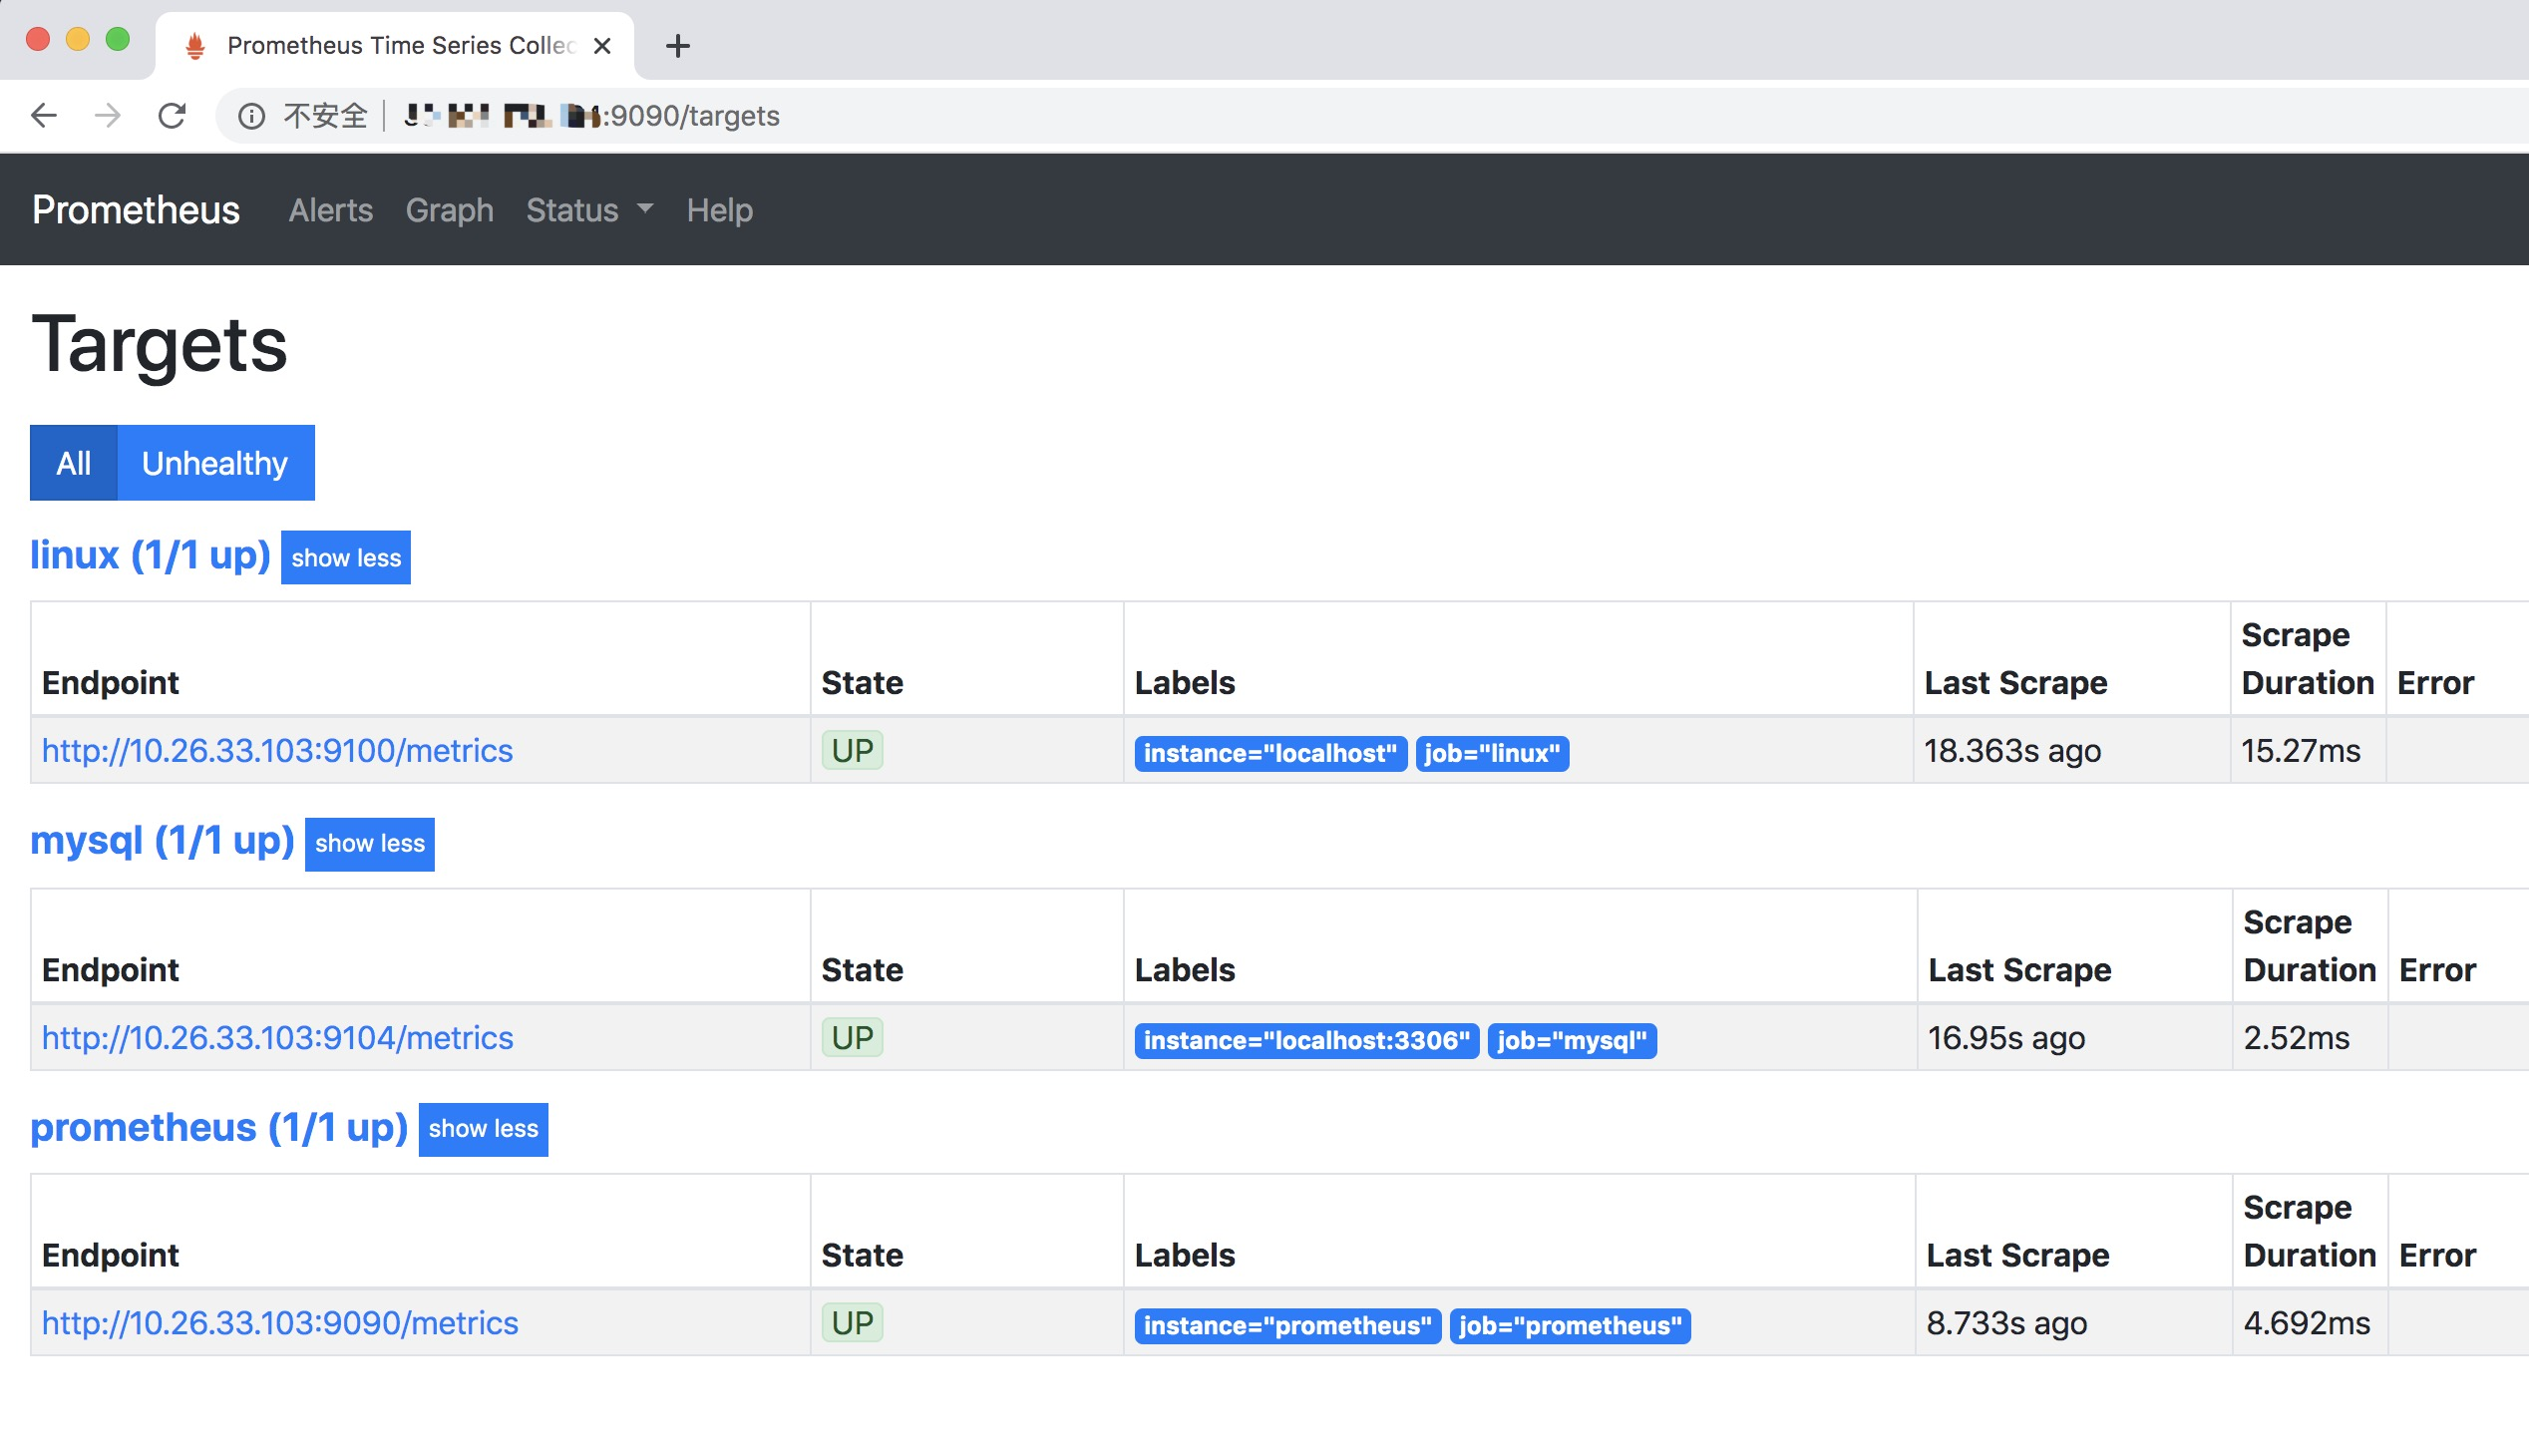
接下来我们点击Graph可以查看到图表
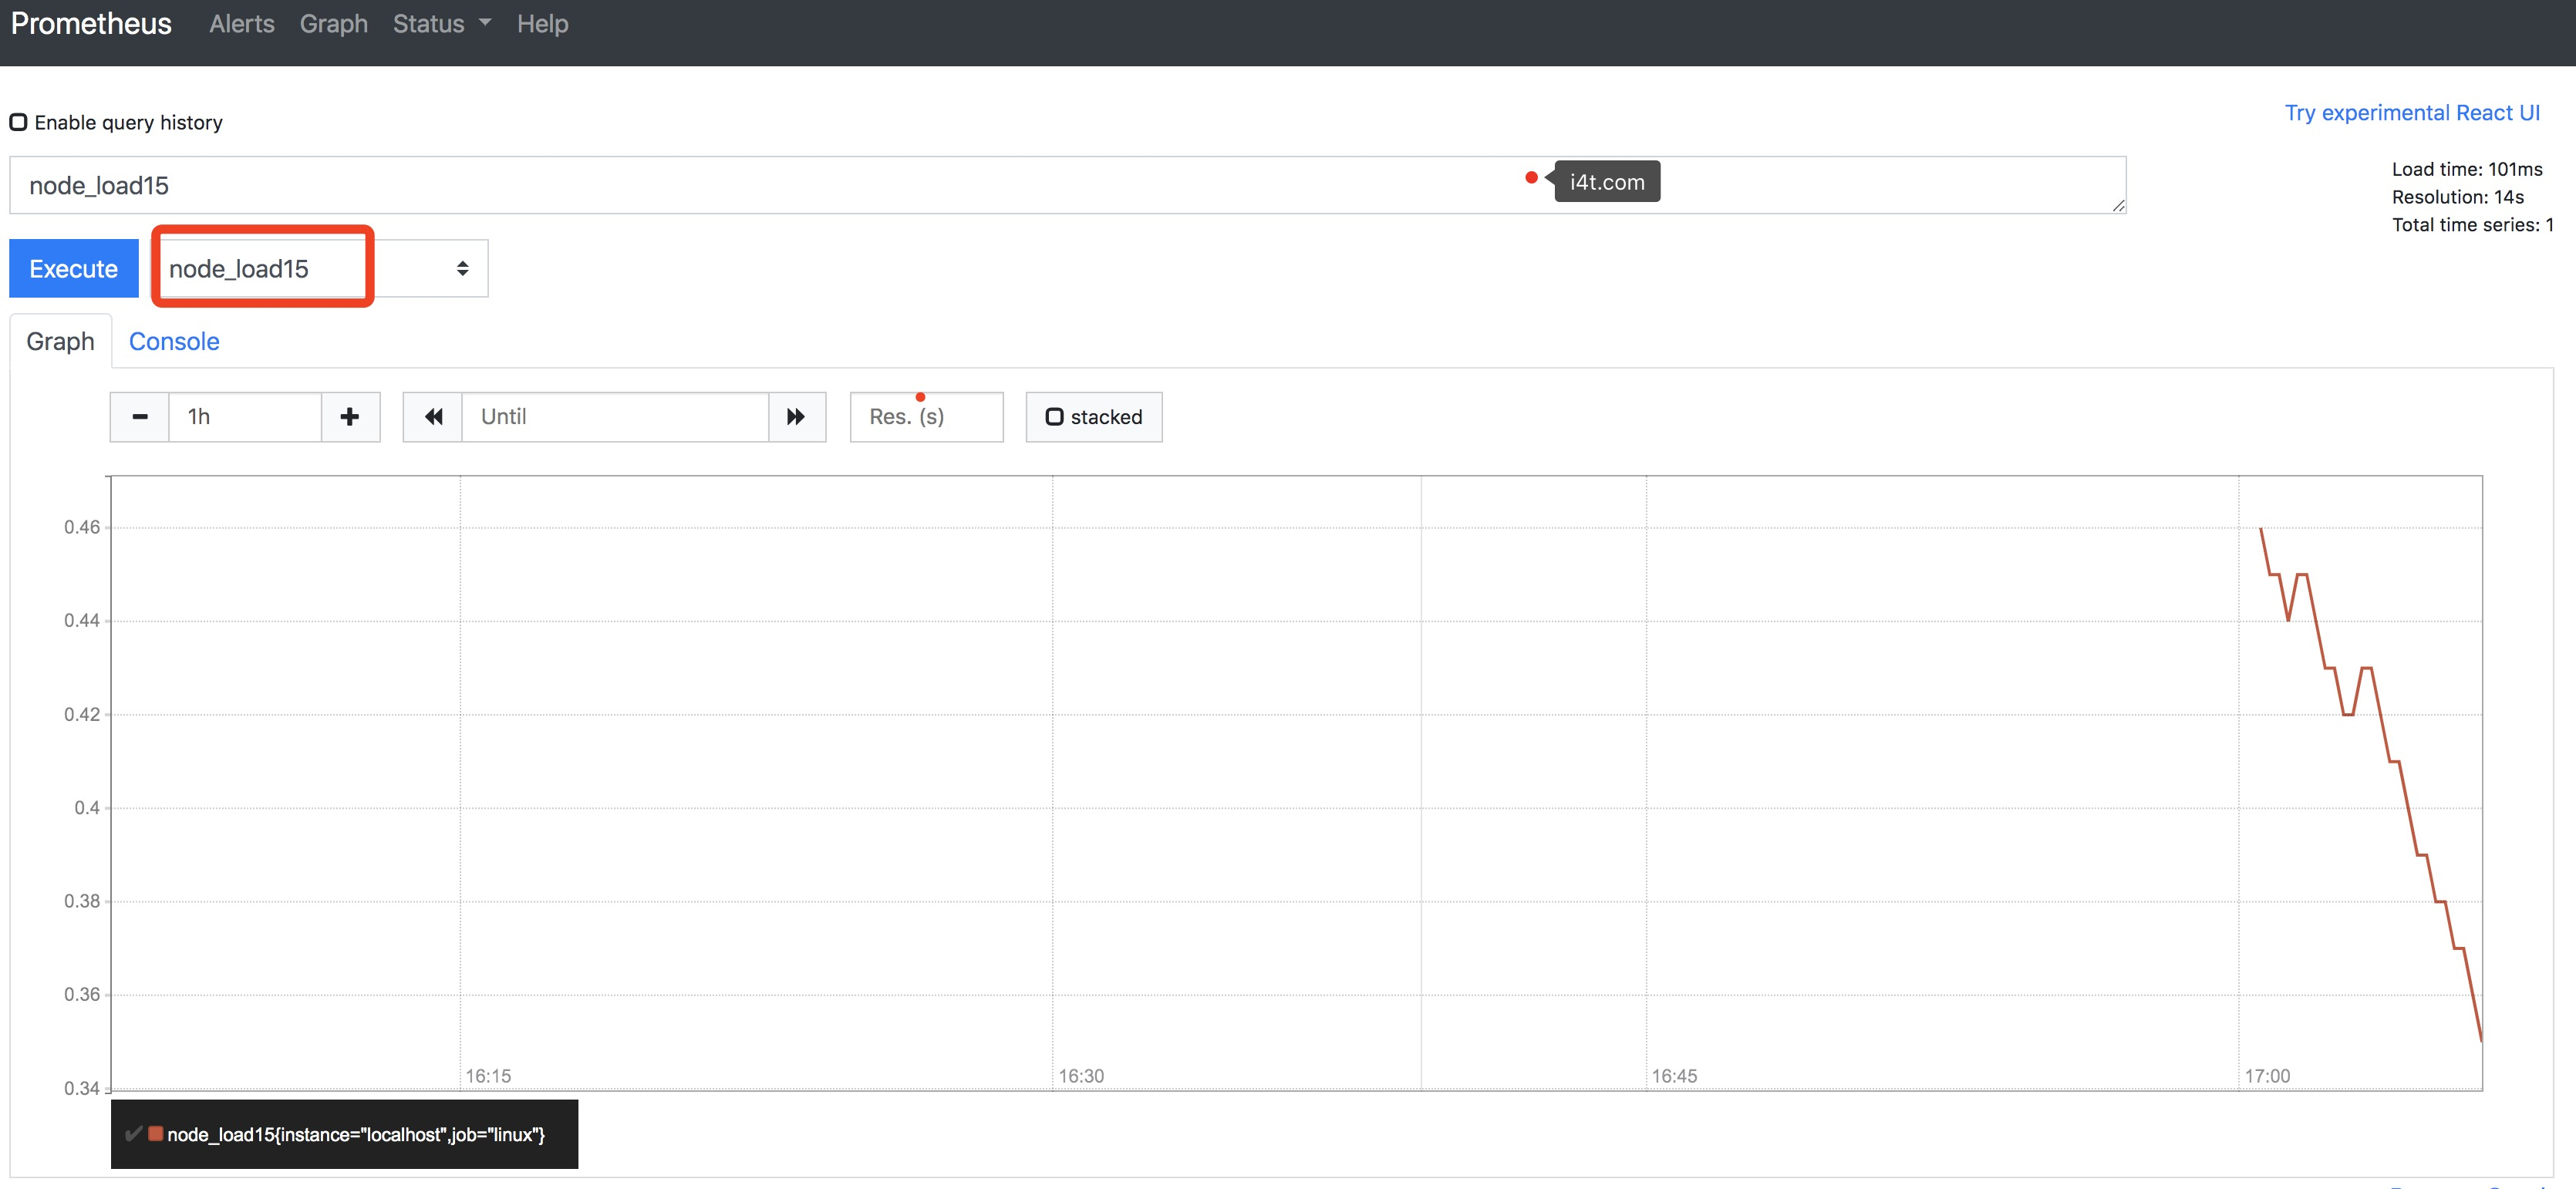
只要有数据写入说明prometheus没有问题,接下来就安装grafana
Grafana
grafana 是一个可视化面包,有着非常漂亮的图片和布局展示,功能齐全的度量仪表盘和图形化编辑器,支持Graphite、Zabbix、InfluxDB、Prometheus、OpenTSDB、Elasticasearch等作为数据源,比Prometheus自带的图标展示功能强大很多,更加灵活,有丰富的插件
Grafana相关步骤可以参考之前监控k8s集群的文档,版本虽然有变化但是大概步骤基本相似

同样grafana使用容器进行运行
mkdir -p /data/grafana-storage
chmod -R 777 /data/grafana-storage

docker run -d \
  -p 3000:3000 \
  --name=grafana \
  -v /data/grafana-storage:/var/lib/grafana \
  registry.cn-beijing.aliyuncs.com/abcdocker/grafana:7.0.3
启动完毕后我们可以到宿主机IP+3000查看服务
默认用户名: admin
默认密码:  admin
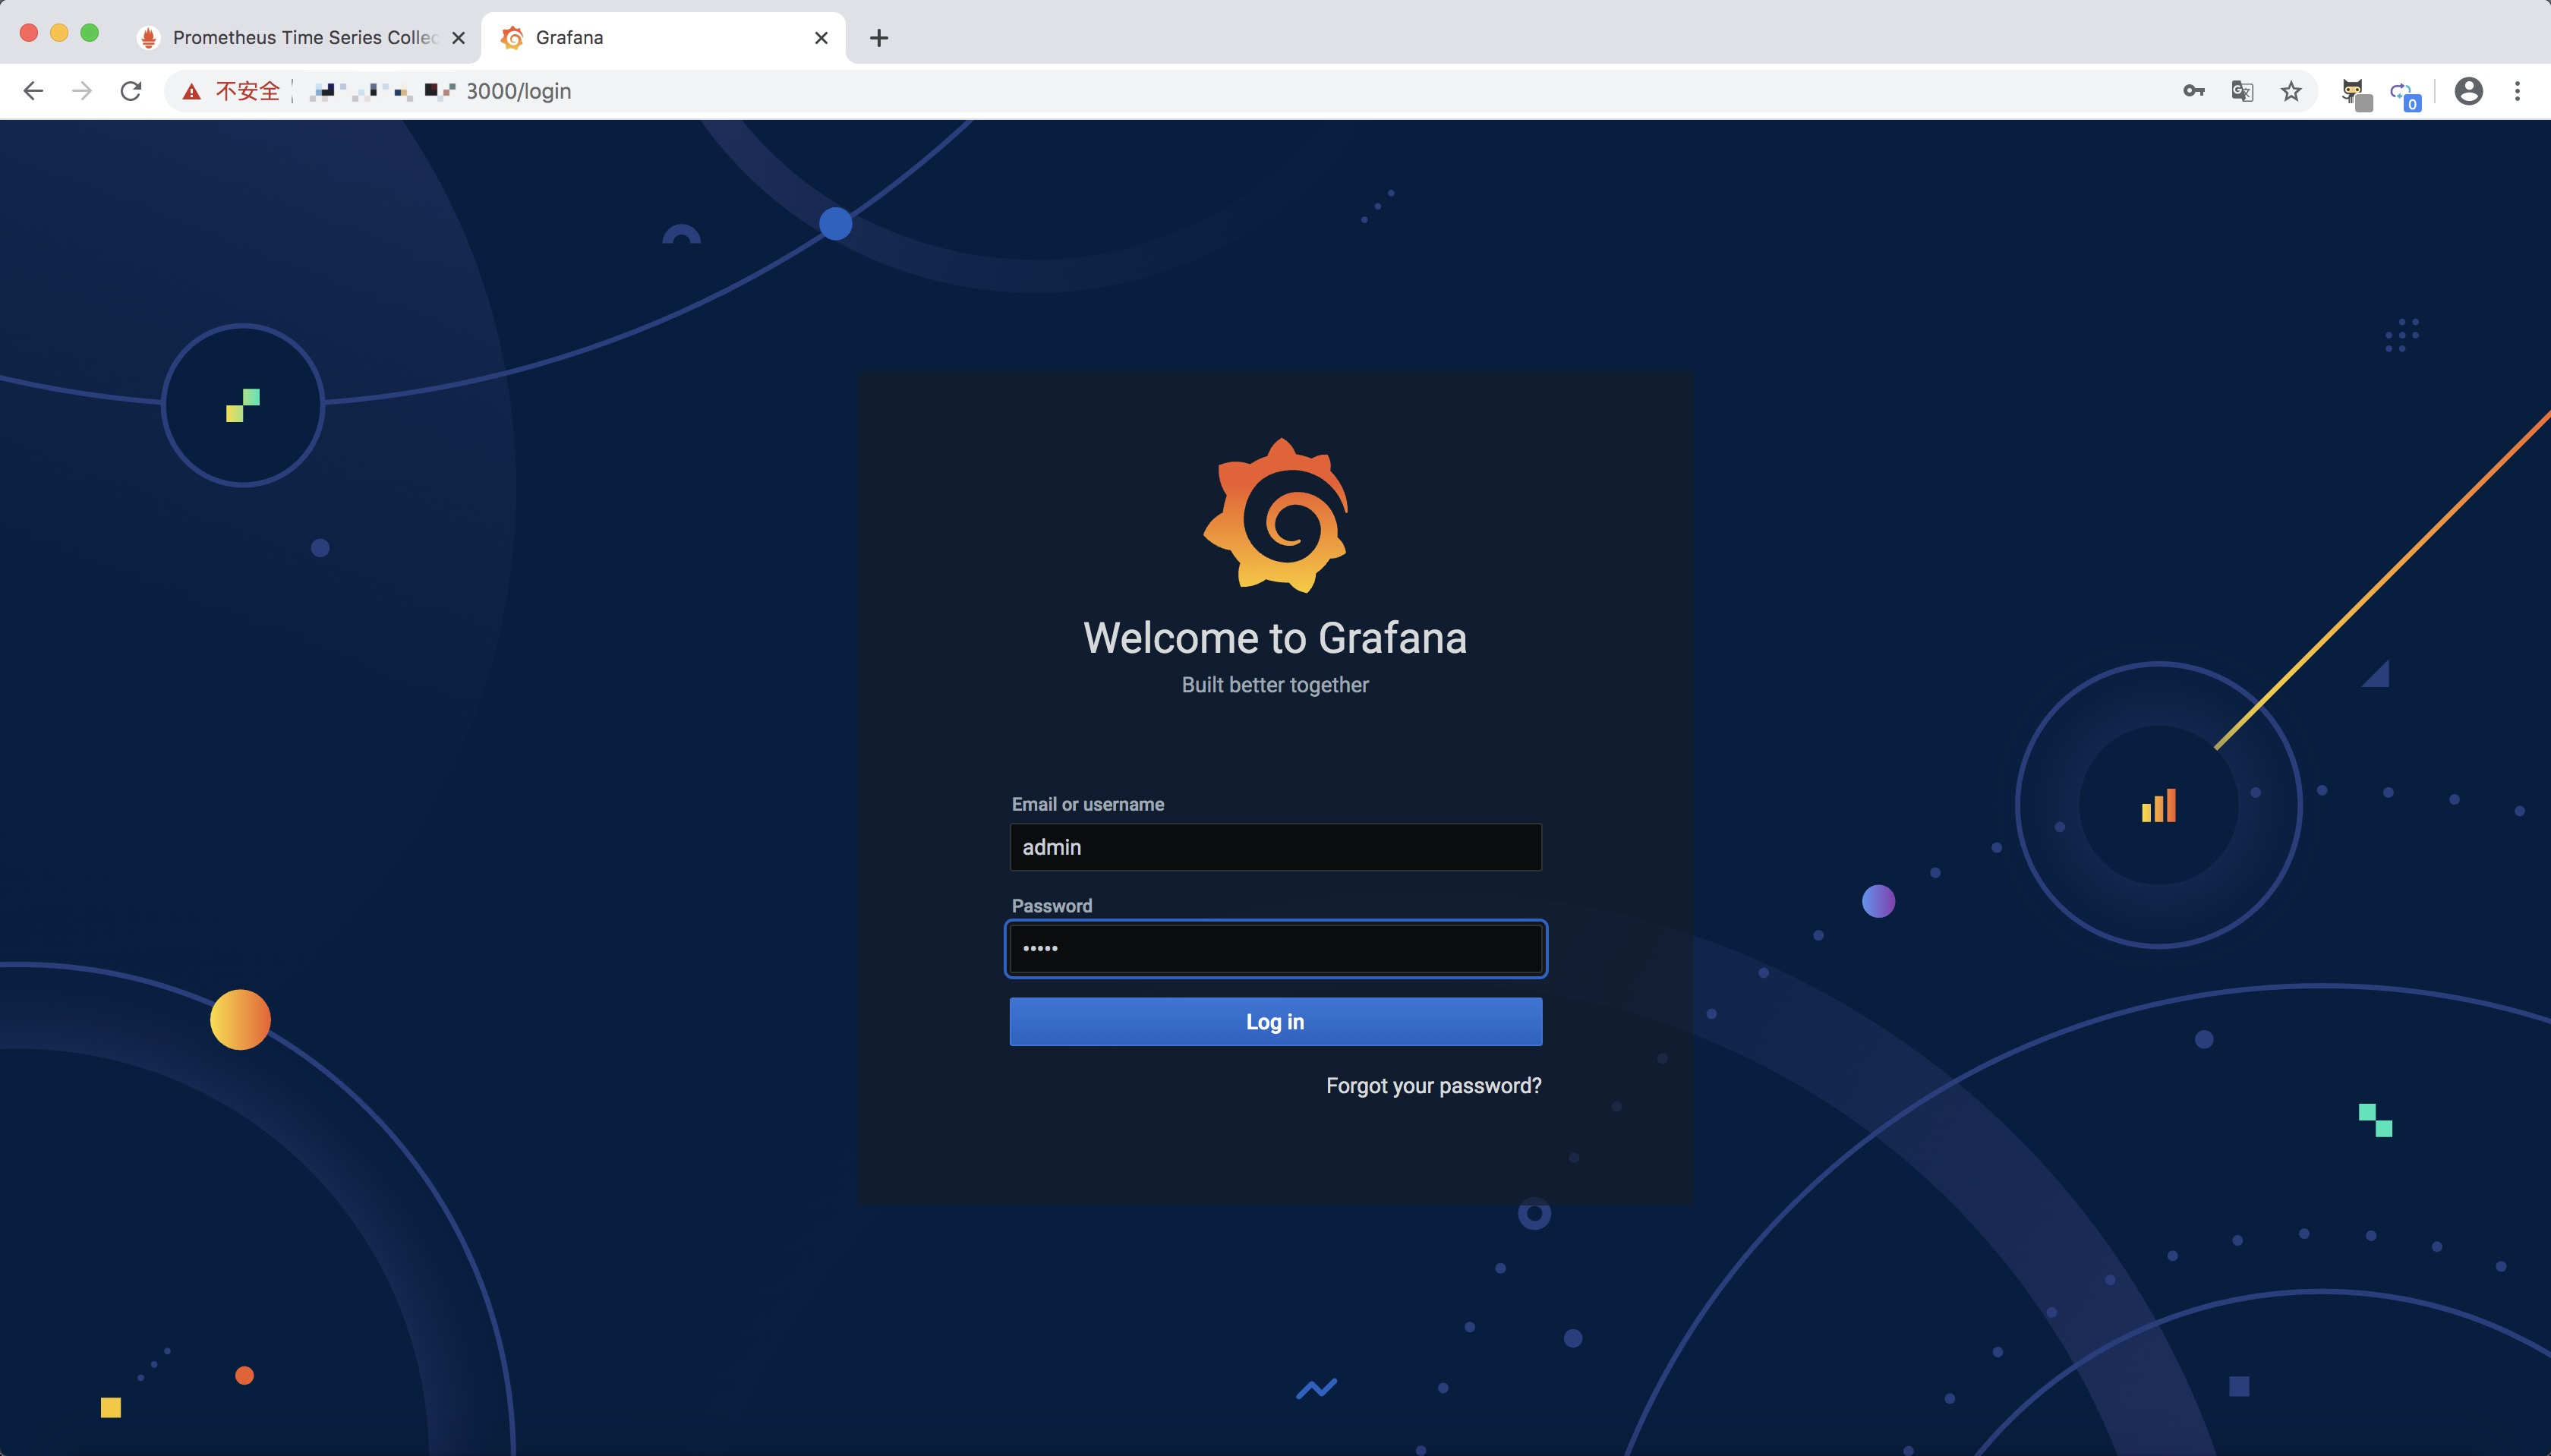
在启动grafana的时候可以设置密码,后面修改也可以的。
第一次登陆会提示我们修改密码

接下来配置prometheus源
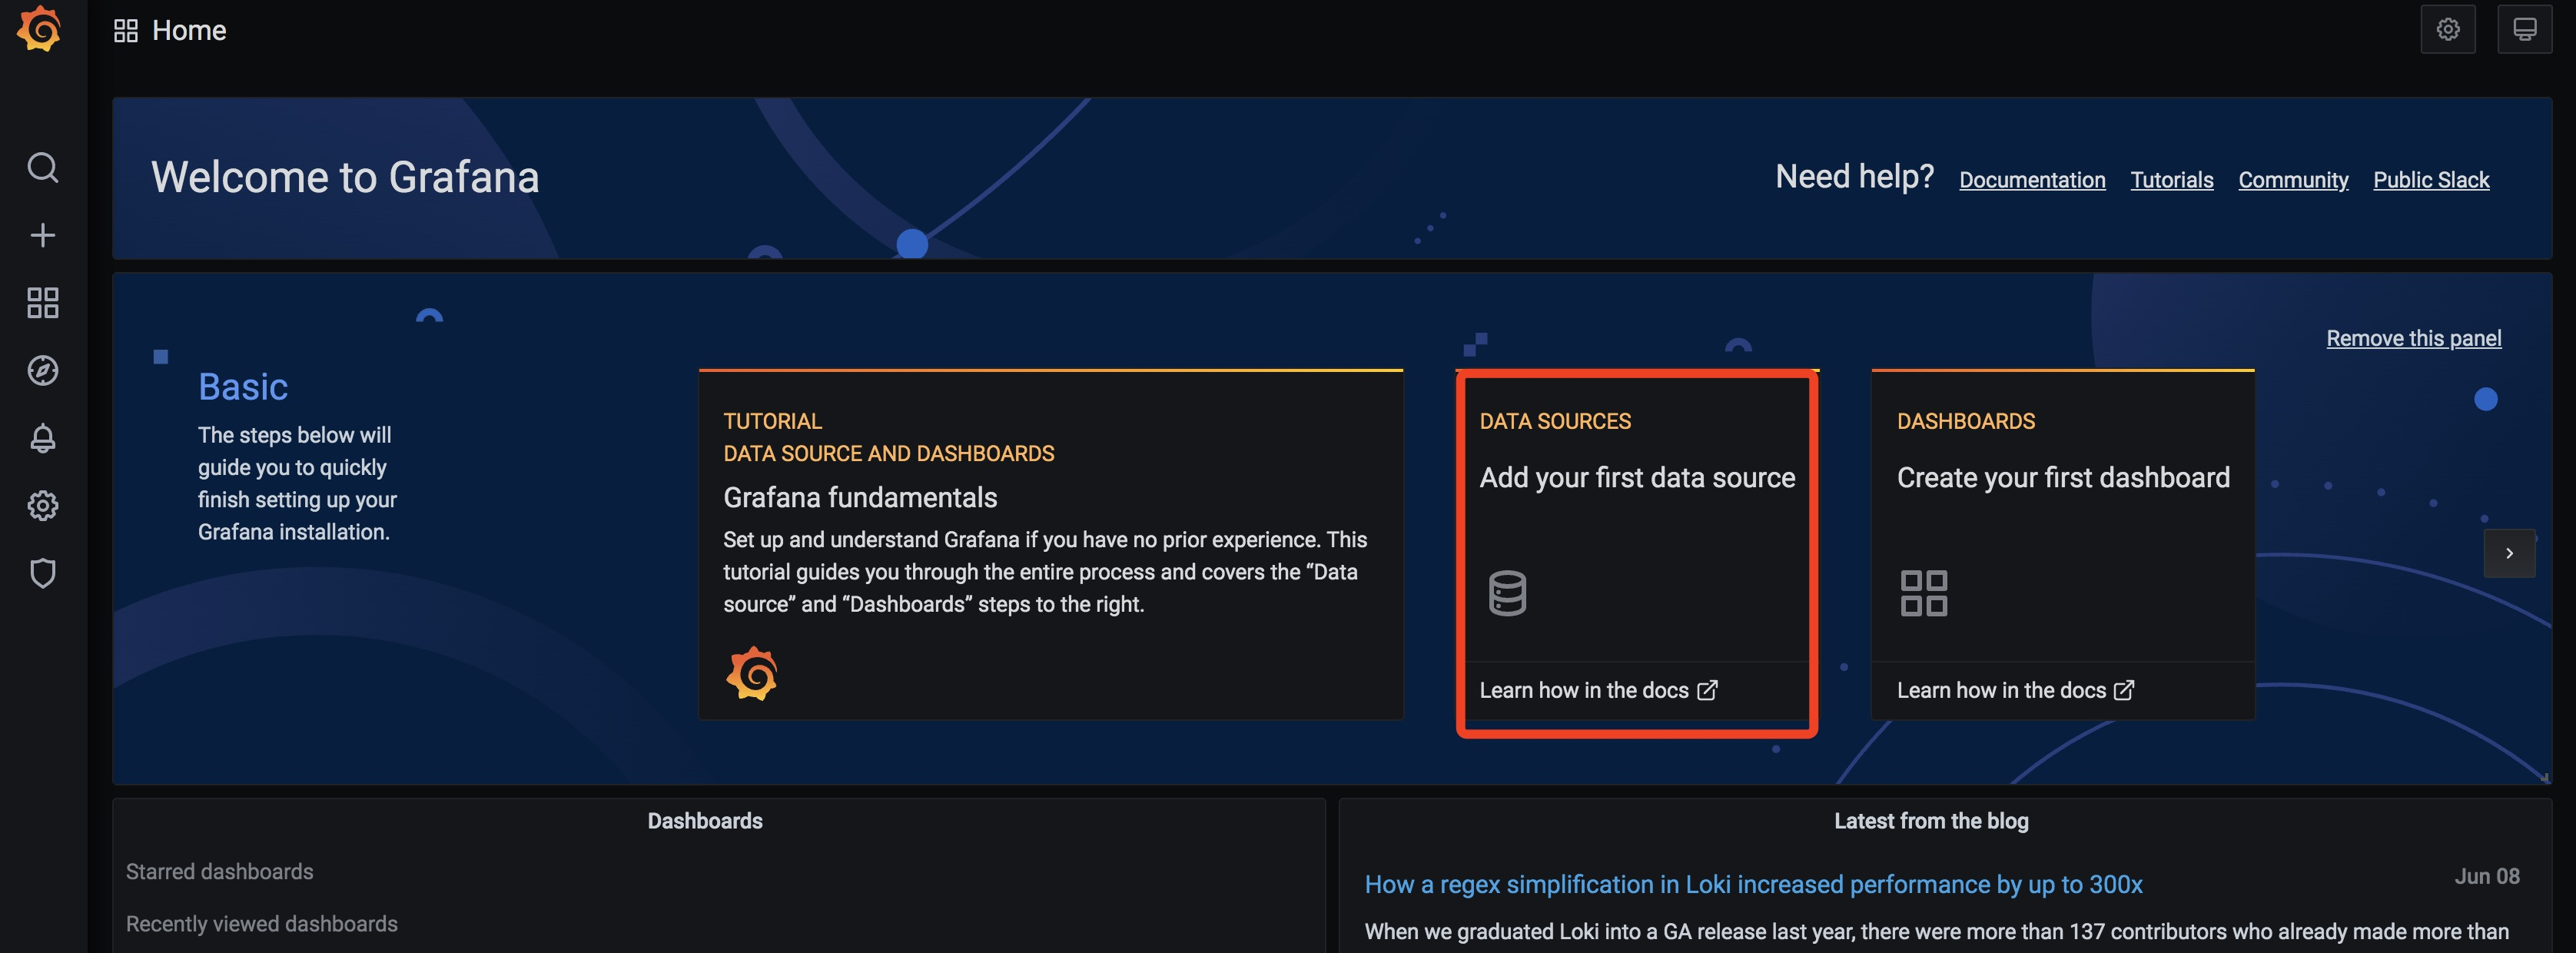
选择添加prometheus源
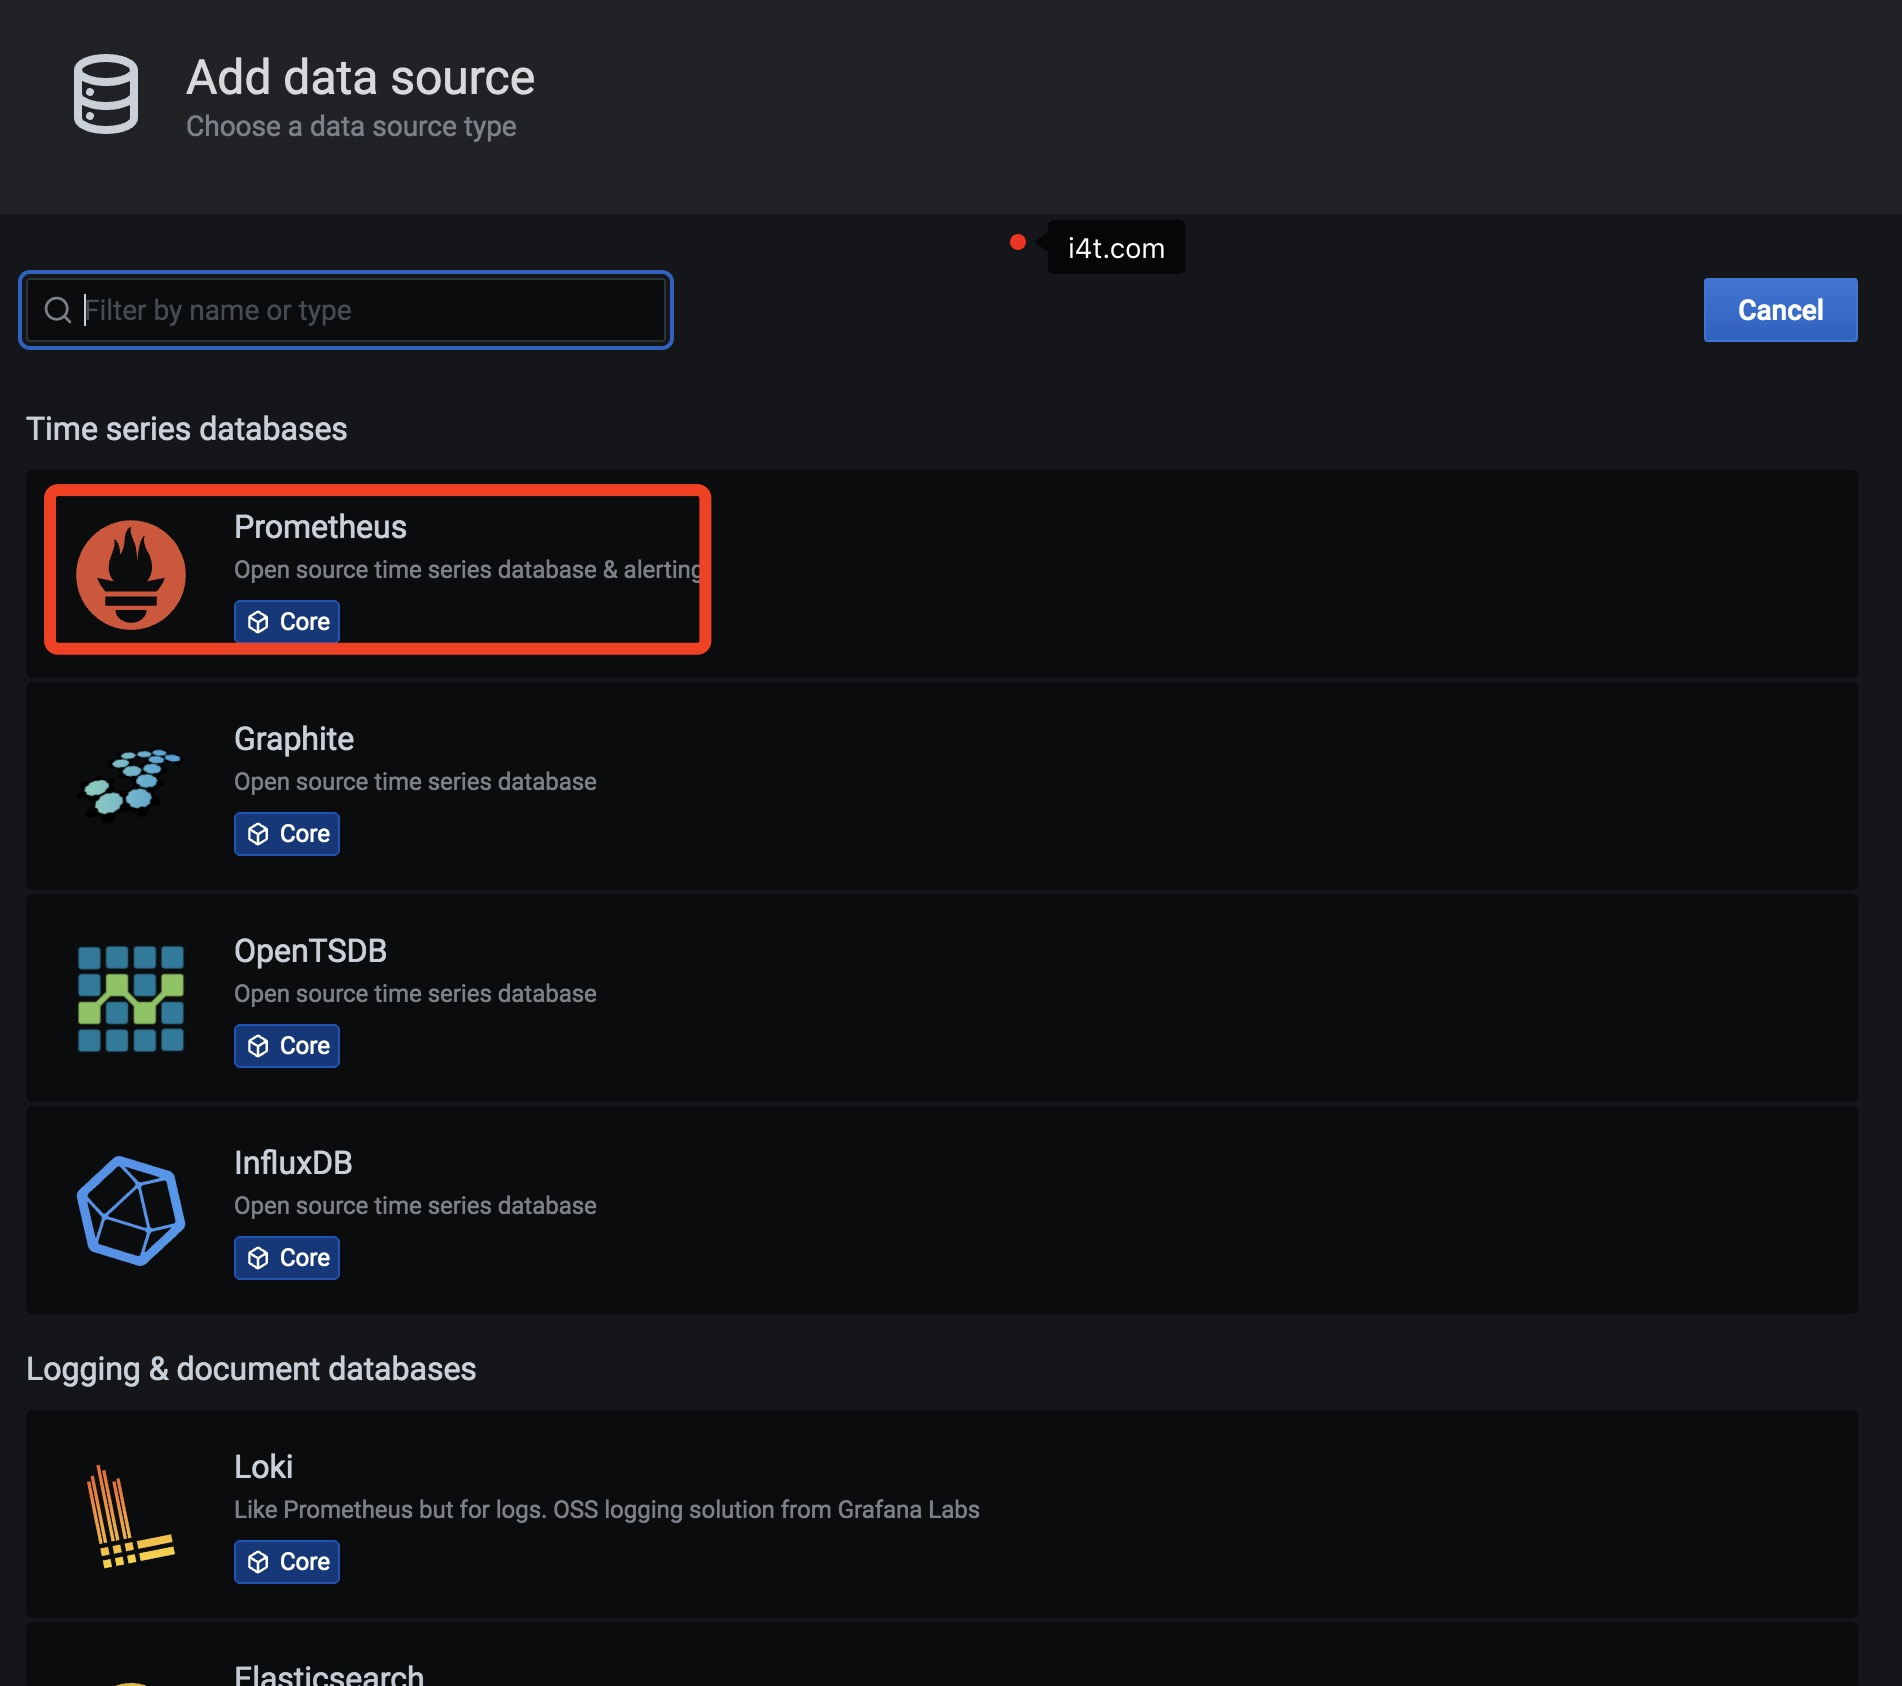
这里只需要添加一个prometheus的地址就可以了,同样建议使用内网IP
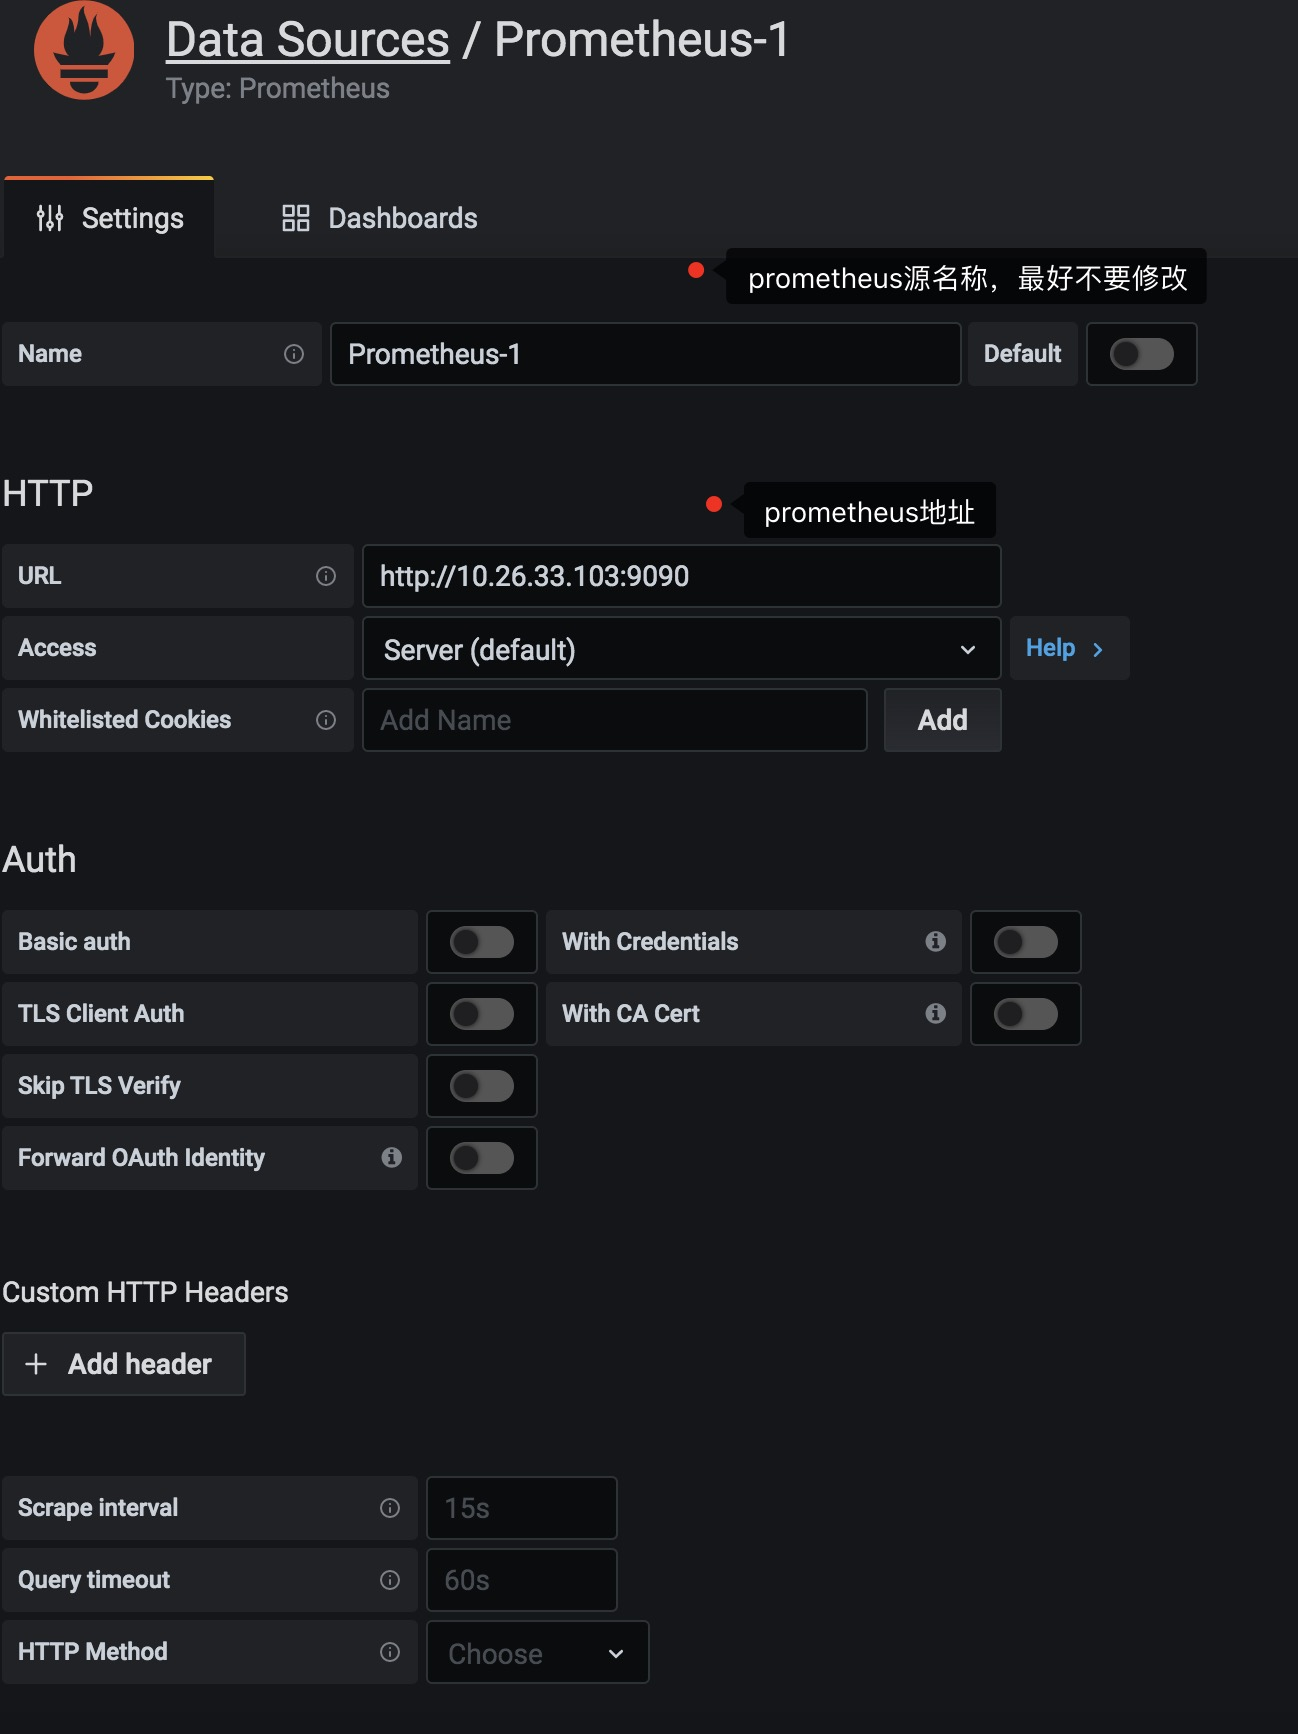
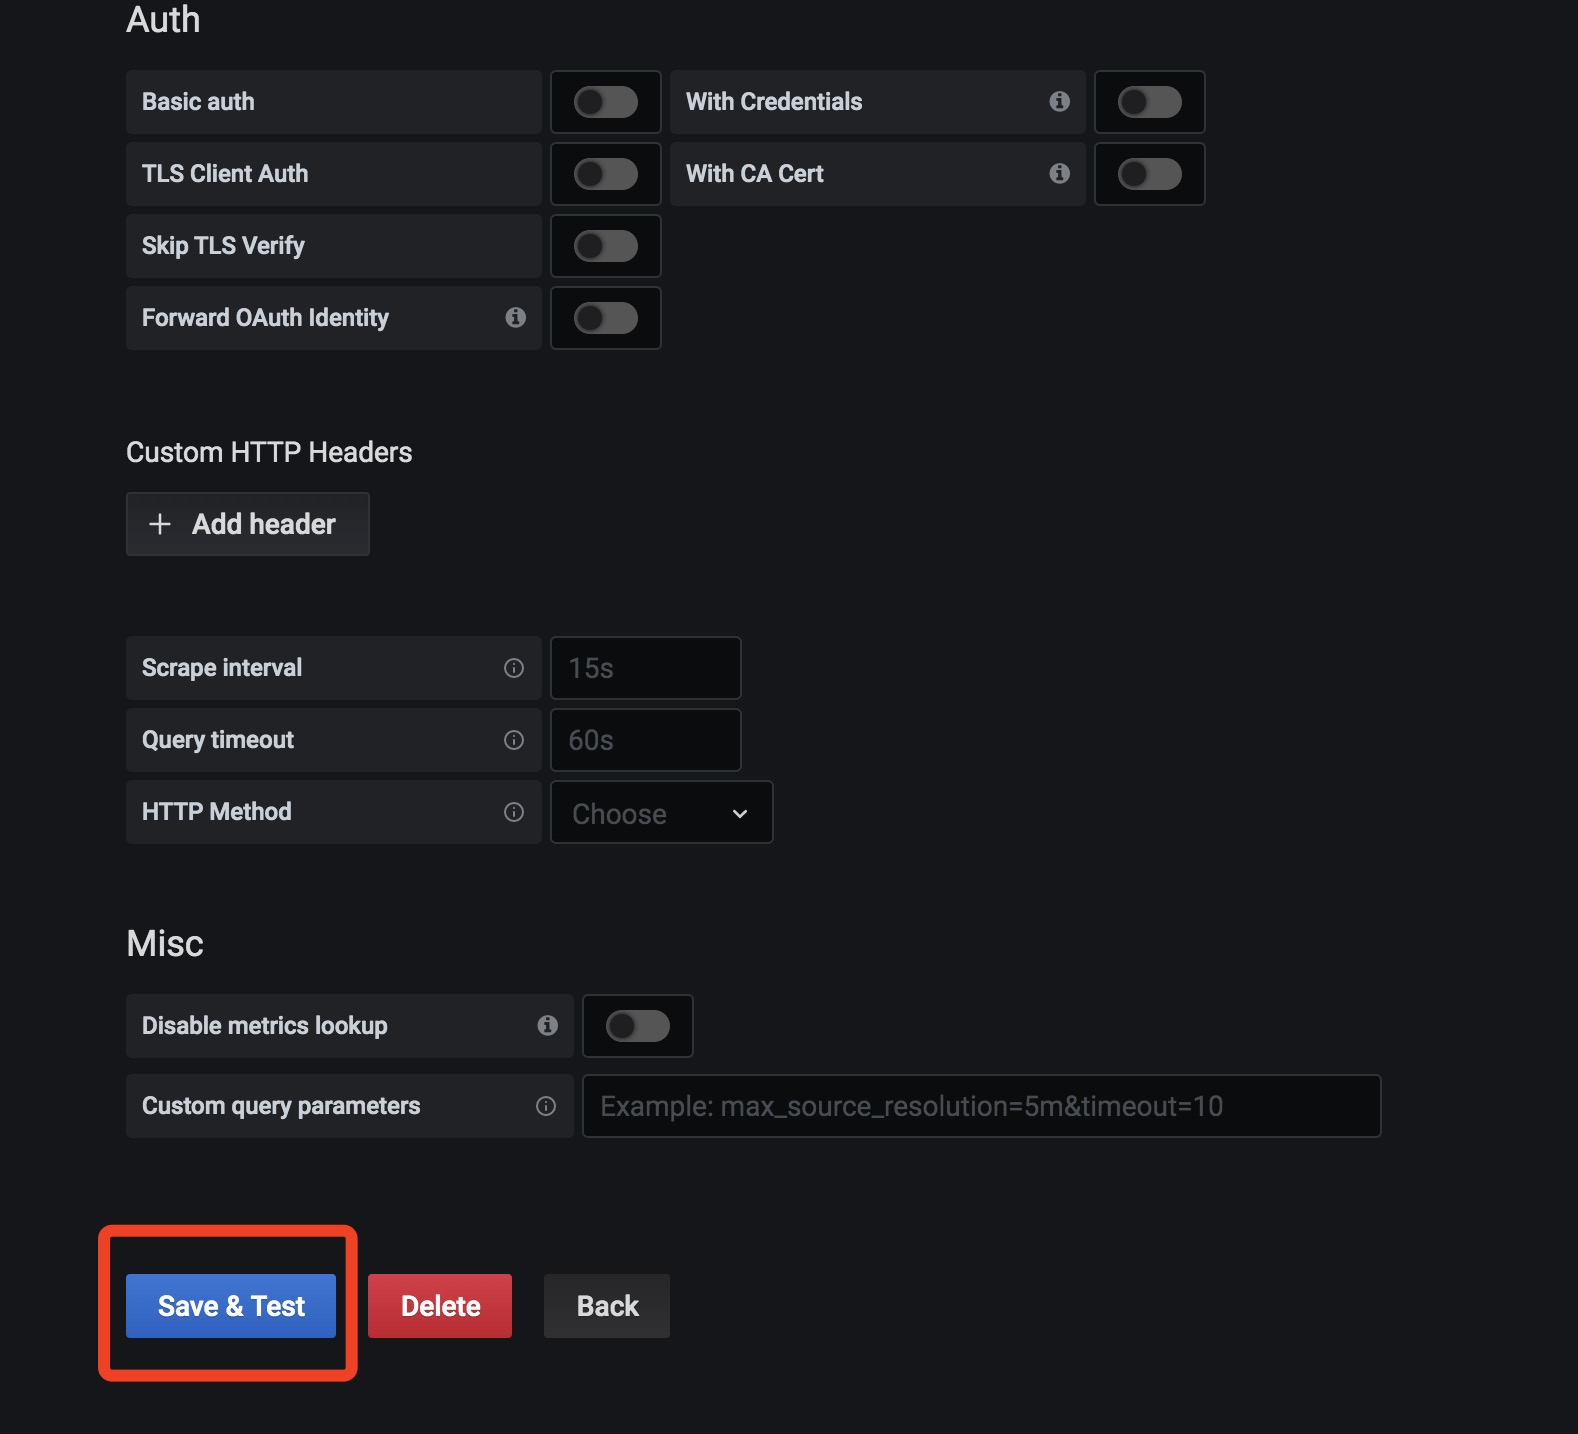
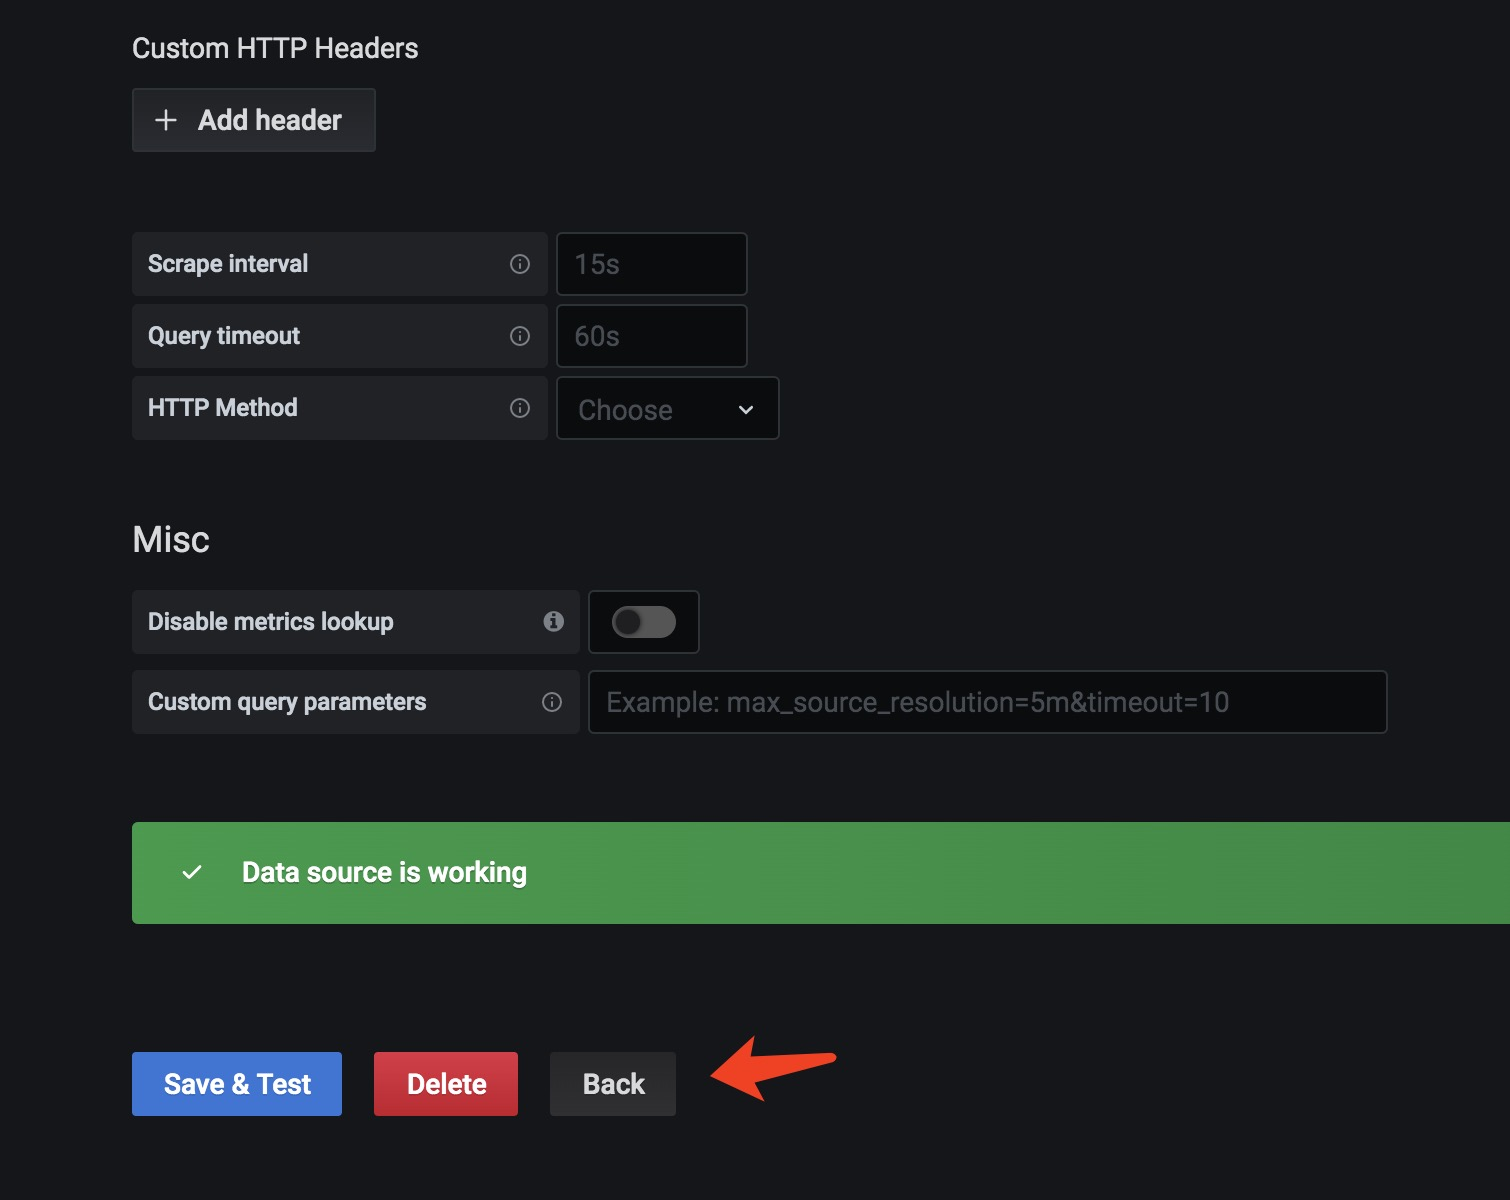
接下来保存测试
连接正常后会有下面的截图
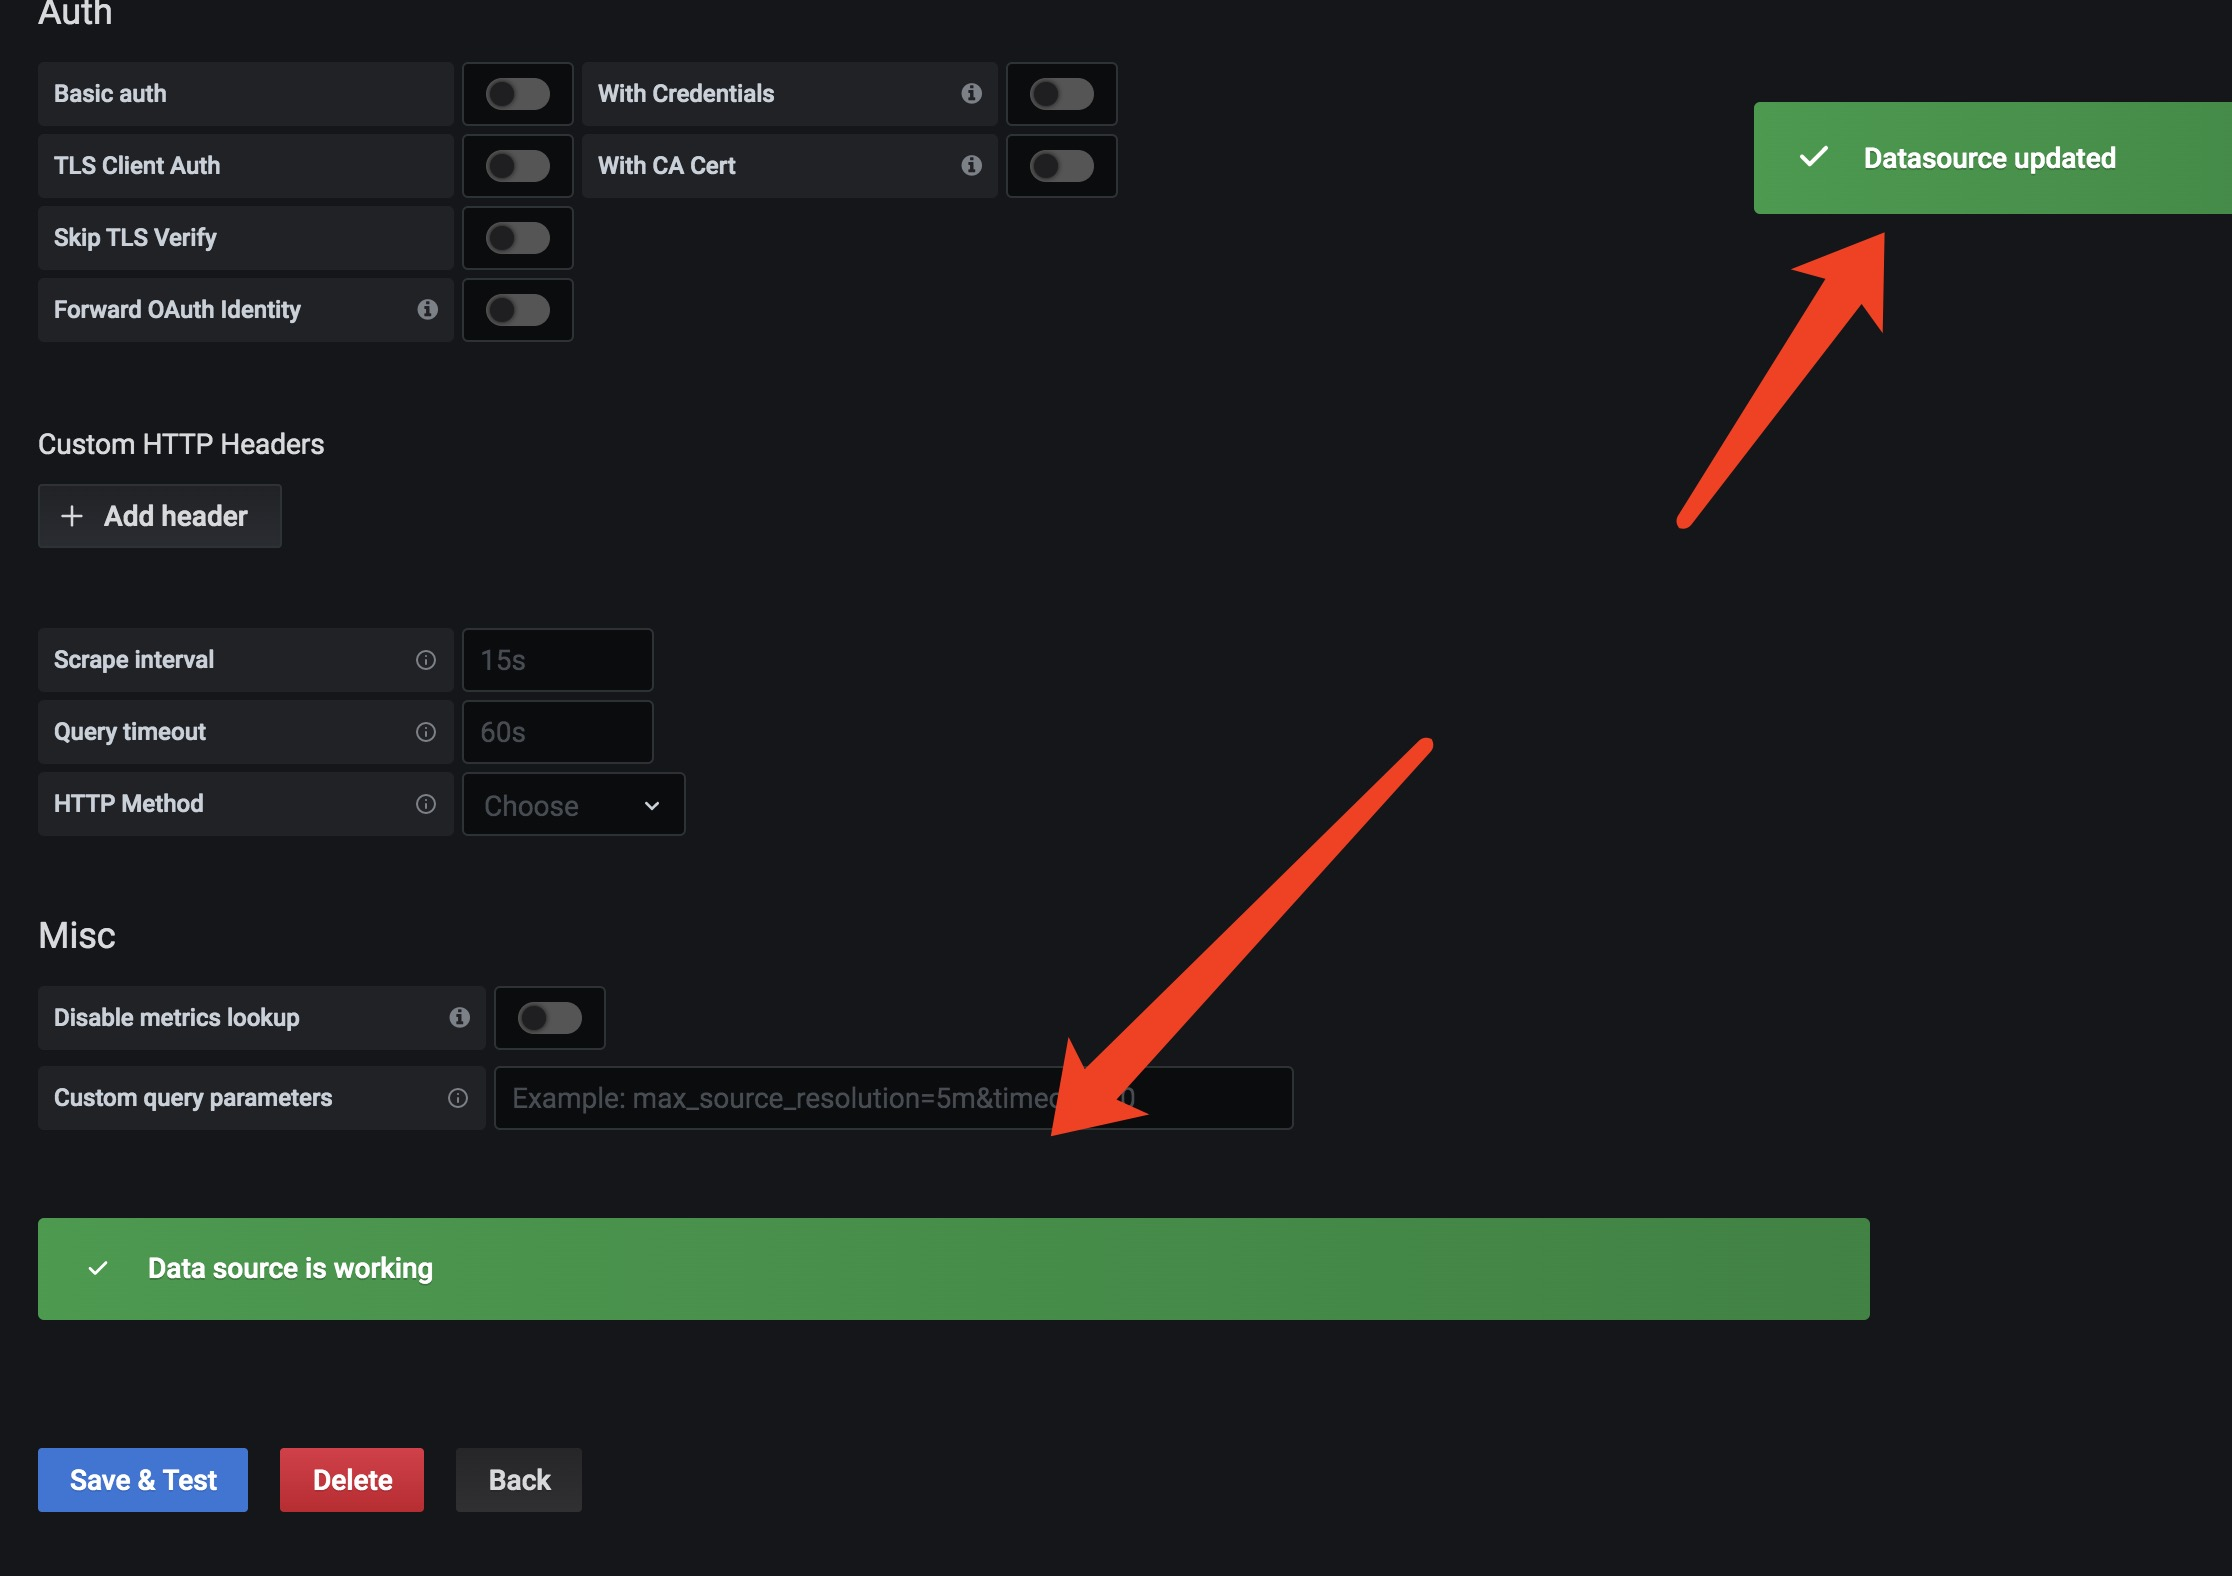
接下来可以点击BACK退出
接下来可以添加监控图片,如果想自定义图片可以使用下面的方法,点击创建图片即可
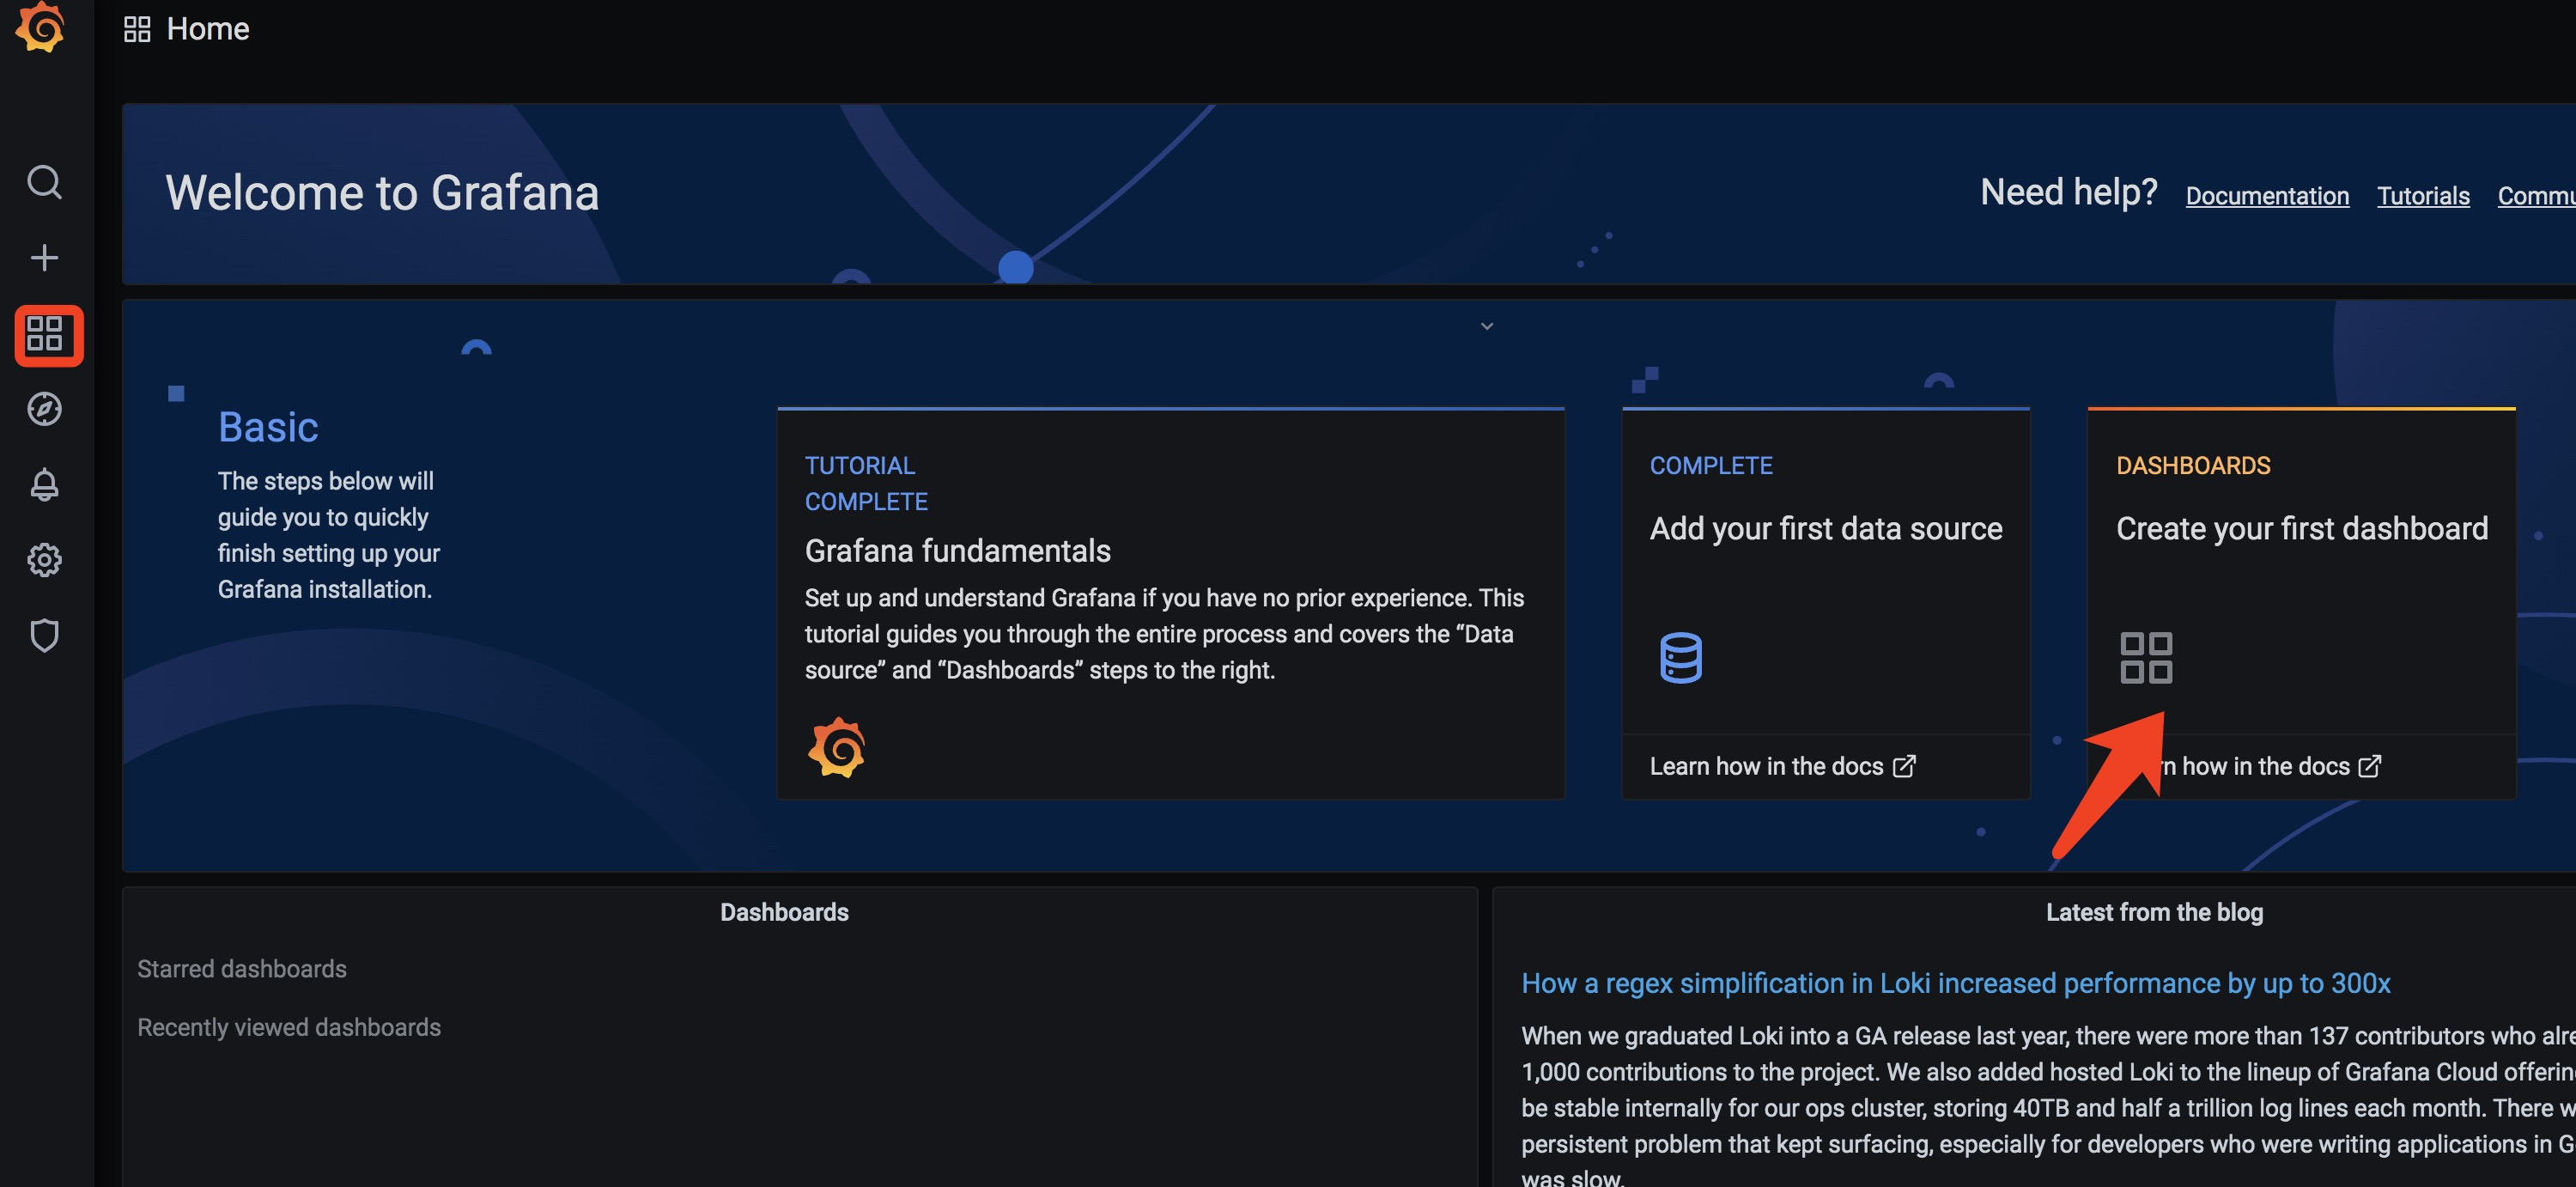
另外一种比较受欢迎的就是导入模板
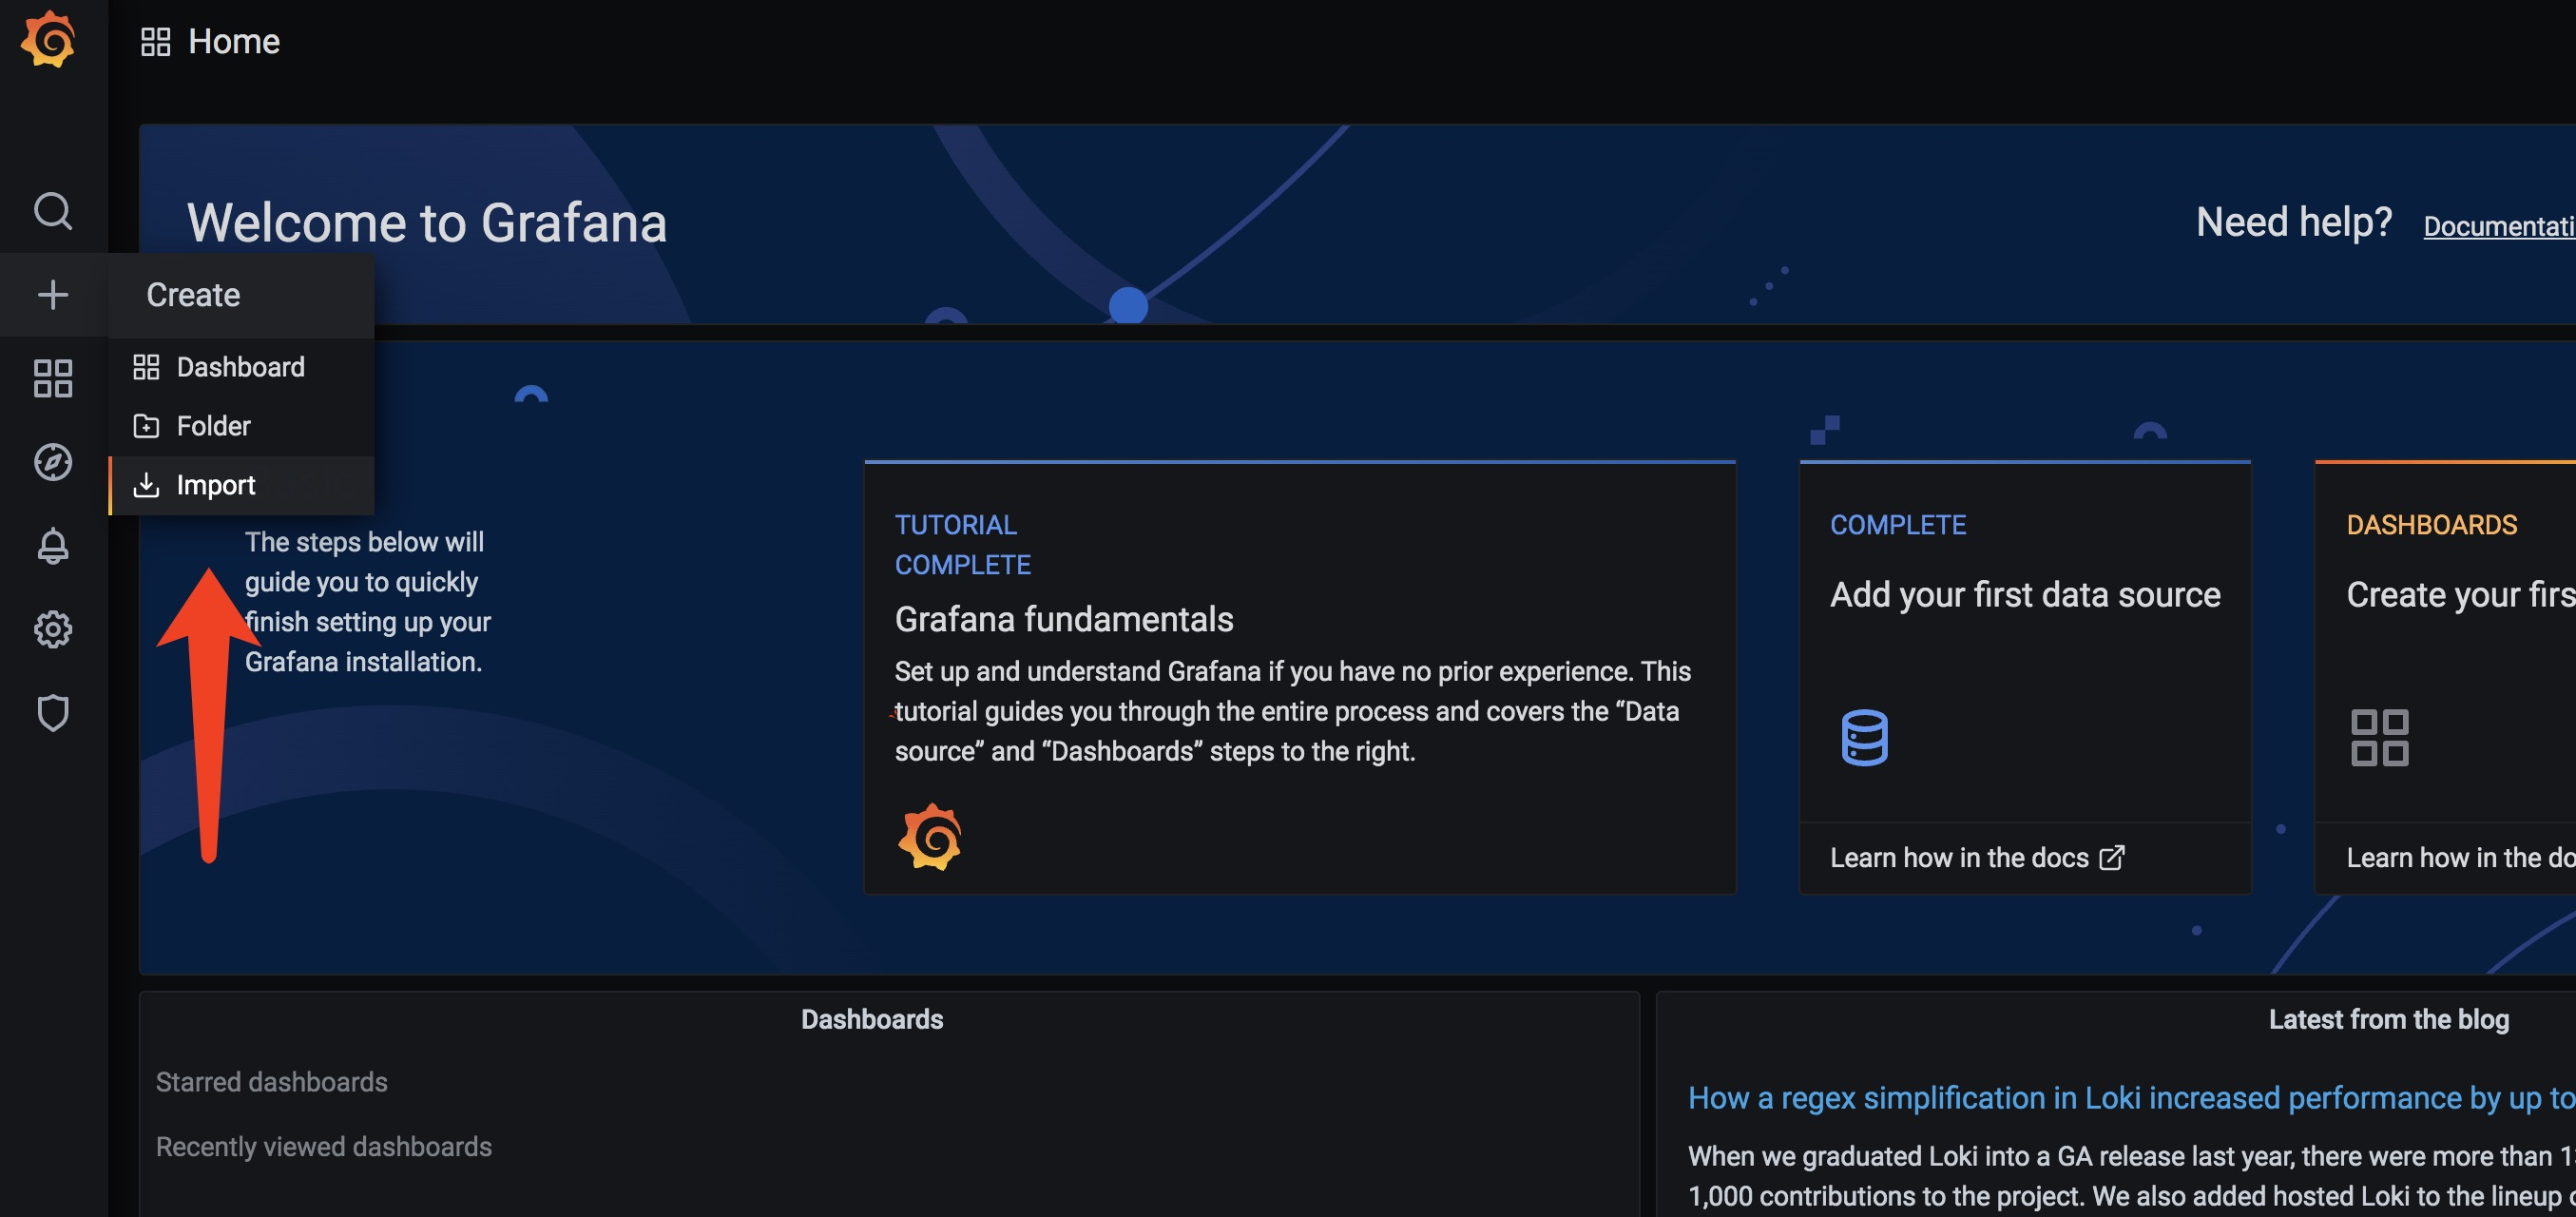
接下来可以到grafana官网找合适的监控项
插件地址https://grafana.com/dashboards/
我们需要找到以下模板
- node_exporter监控模板
- mysqld_exporter监控模板
node_exporter监控模板使用最新的中文监控https://grafana.com/grafana/dashboards/8919
mysqld_exporter监控模板使用 https://grafana.com/grafana/dashboards/7362
这里导入node_exporter模板
这里可以属于上面整个url,或者直接输入后面ID都可以
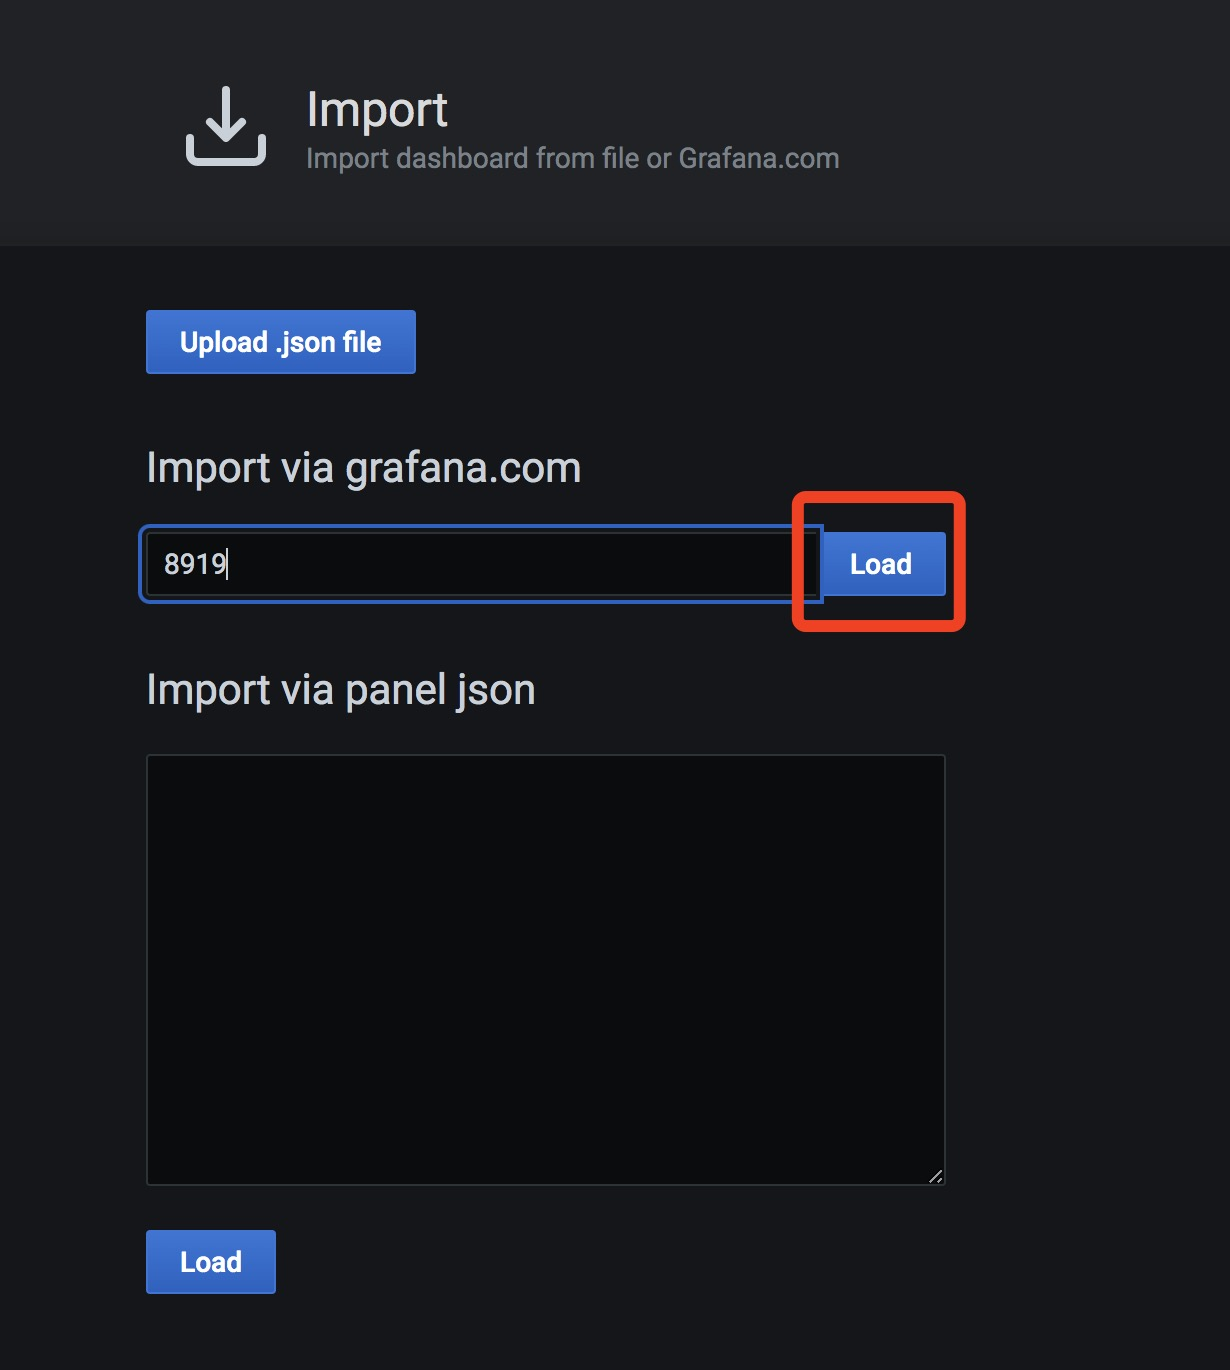
数据源选择我们创建的,prometheus-1
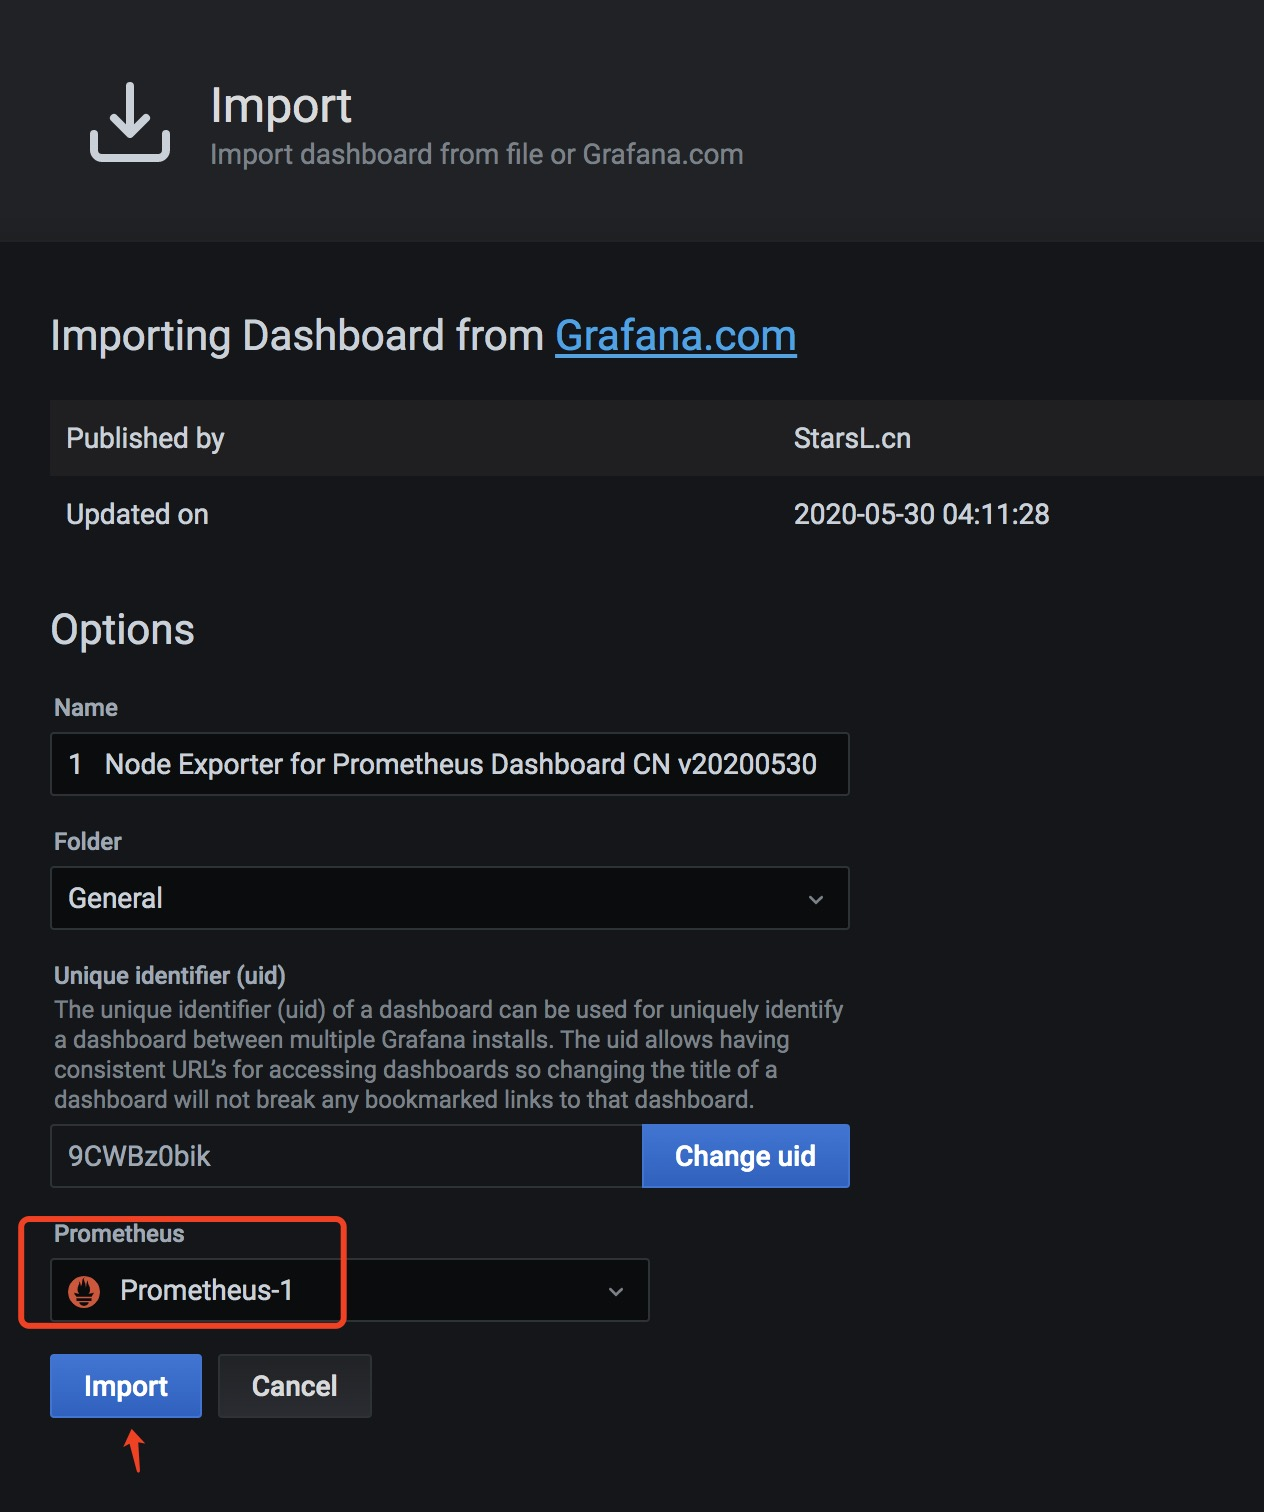
导入完成后会出现下面的截图
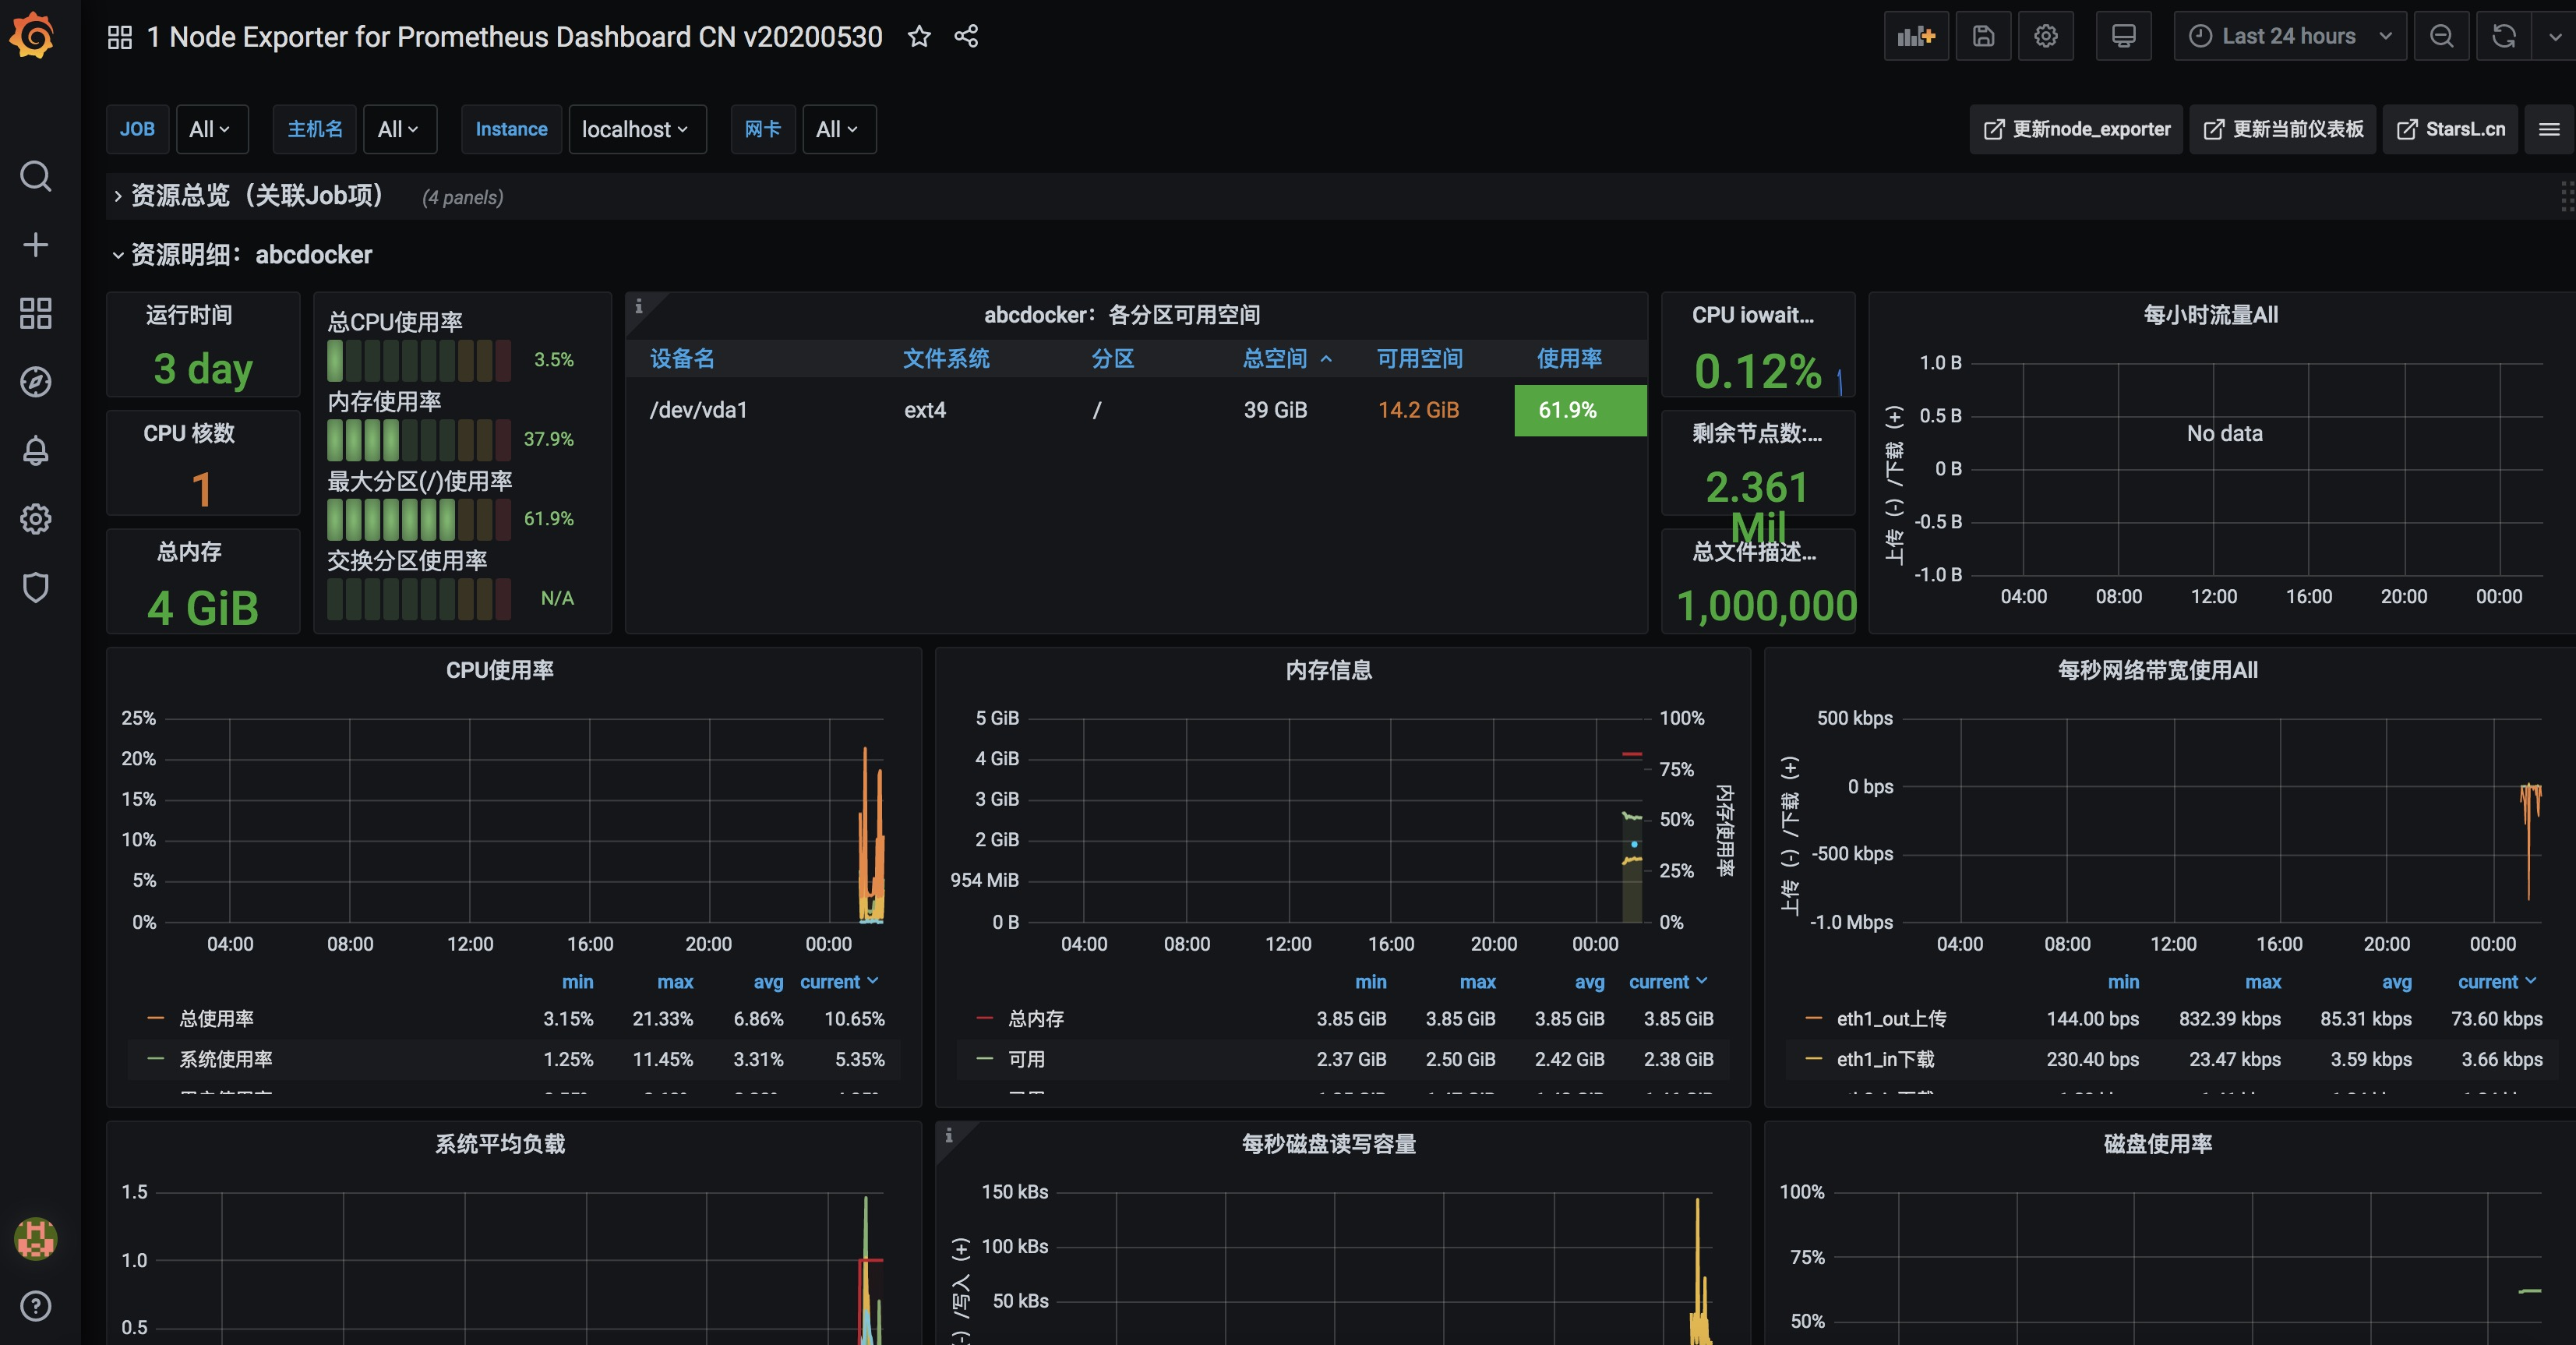
node_exporter到这里监控完毕
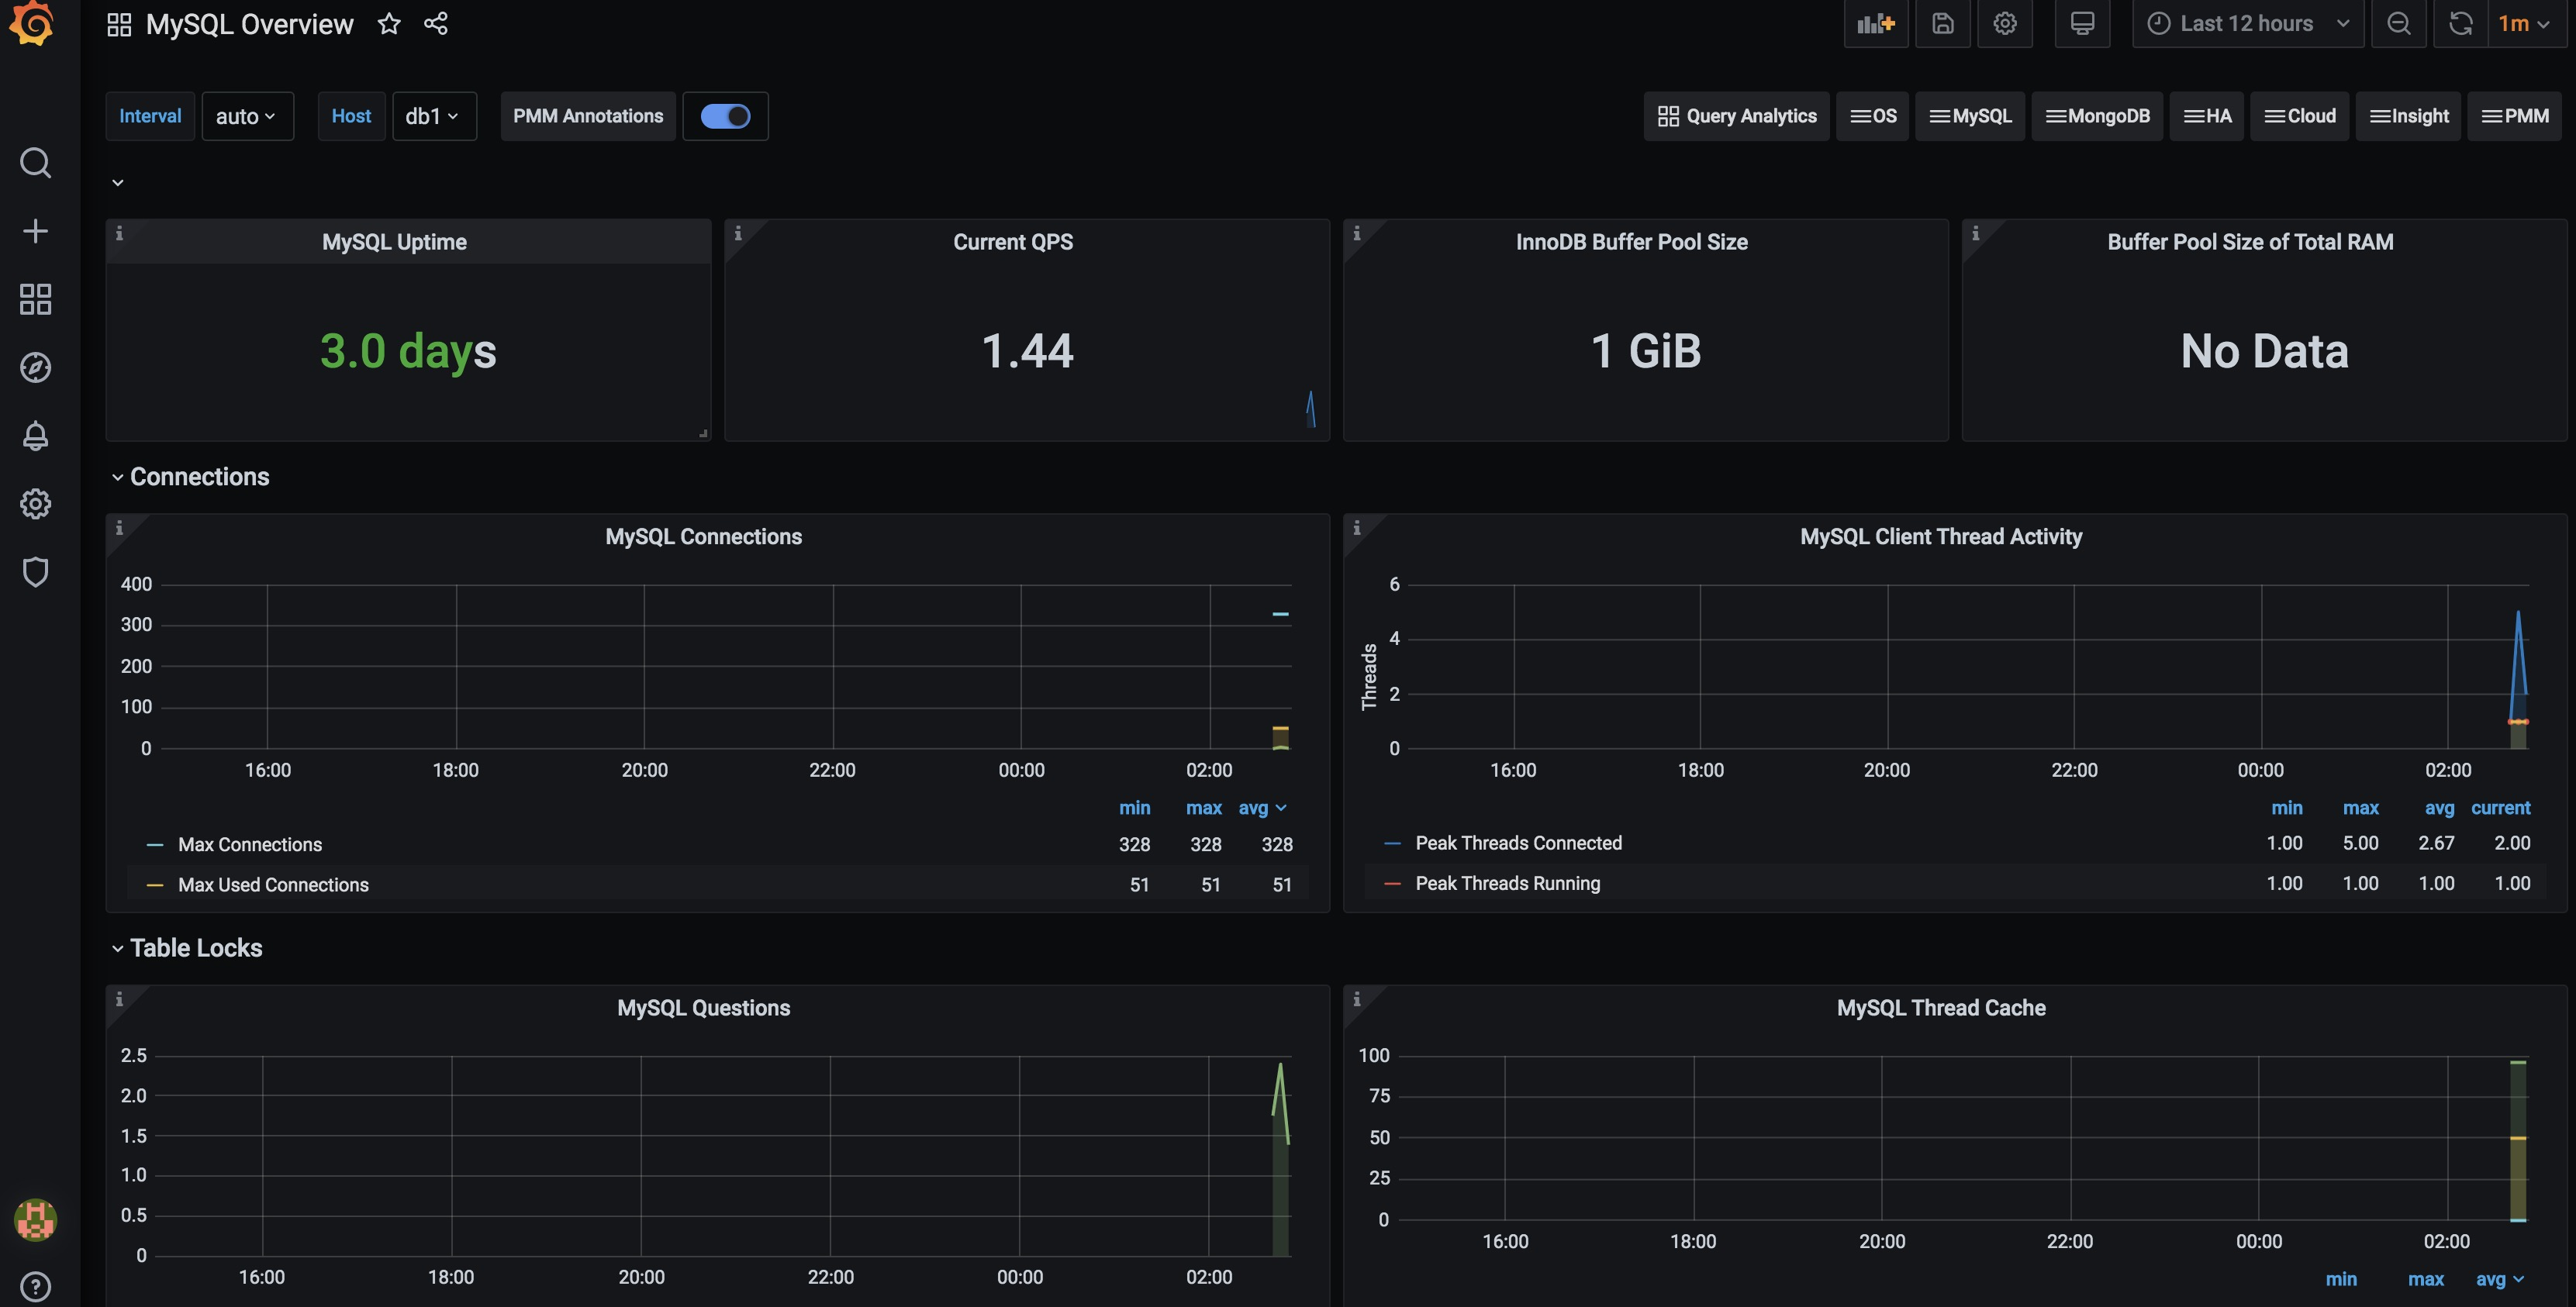
相同方法导入mysqld_exporter
mysqld_exporter监控模板使用 https://grafana.com/grafana/dashboards/7362
目前是监控项添加完毕,后面是添加alertmanager告警


test
网站速度不错~
[…] Prometheus 监控MySQL数据库 […]
[…] Prometheus 监控MySQL数据库 […]
监控云上RDS,grafana 不展示数据有没有解决方案:Buffer Pool Size of Total RAM图表值显示No data
你要复制一下语法,去prometheus查看一下。 有可能是没有获取到这个值,或者名字改了。 晚点我尝试一下
[…] Docker版本 https://i4t.com/4741.html […]
[…] […]
[…] […]