
文章目录
MGR
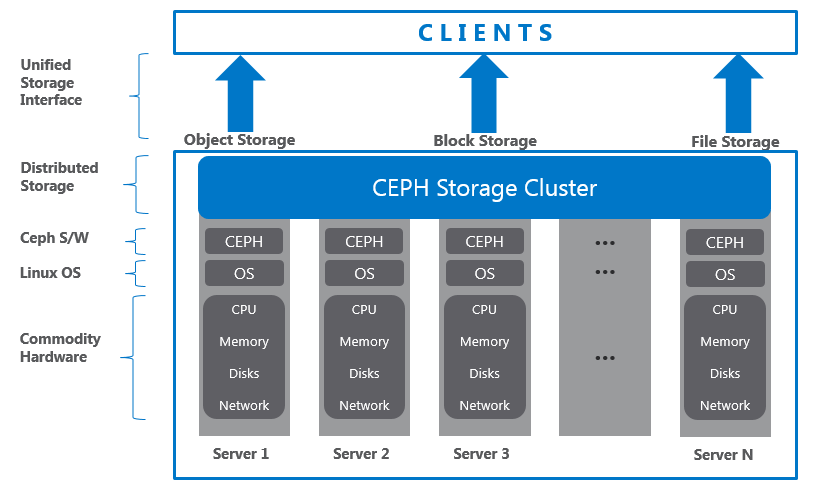
Manager:管理器 Ceph管理器守护程序(Cephmgr)负责跟踪运行时指标和Ceph群集的当前状态,包括存储利用率、当前性能指标和系统负载。Ceph管理器守护进程还托管基于python的模块,以管理和公开Ceph集群信息,包括基于web的Ceph仪表板和Restful APT。高可用性通常需要至少两个管理器。
CEPH安装可以参考下面文章

查看集群状态
[root@ceph-01 ~]# ceph -s
  cluster:
    id:     c8ae7537-8693-40df-8943-733f82049642
    health: HEALTH_OK

  services:
    mon: 3 daemons, quorum ceph-01,ceph-02,ceph-03 (age 2h)
    mgr: ceph-03(active, since 17h), standbys: ceph-01, ceph-02
    mds: cephfs-abcdocker:1 cephfs:1 {cephfs-abcdocker:0=ceph-01=up:active,cephfs:0=ceph-02=up:active} 1 up:standby
    osd: 4 osds: 4 up (since 17h), 4 in (since 3w)
    rgw: 2 daemons active (ceph-01, ceph-02)

  task status:

  data:
    pools:   13 pools, 656 pgs
    objects: 3.77k objects, 12 GiB
    usage:   41 GiB used, 139 GiB / 180 GiB avail
    pgs:     656 active+clean

  io:
    client:   2.0 KiB/s wr, 0 op/s rd, 0 op/s wr

#目前我们集群是ceph-03提供服务,ceph-02,ceph-01为从节点
Ceph
ceph-03为提供服务的节点,所以先需要在ceph-03开启dashboard
我们首先需要安装ceph dashboard
#在ceph-mgr节点开启dashboard

yum install -y ceph-mgr-dashboard
检查是否开启dashboard模块
默认没有开启
#如果可以过滤出来,则不需要开启
ceph mgr module ls | grep dashboard

#开启dashboard
ceph mgr module enable dashboard
#提示报错可以使用
ceph mgr module enable dashboard --force
设置mgr-dashboard监听信息
#设置监听地址
ceph config set mgr mgr/dashboard/server_addr 0.0.0.0

#设置端口号
ceph config set mgr mgr/dashboard/server_port 7000

#关闭ssl验证
ceph config set mgr mgr/dashboard/ssl false
创建管理员用户
最新的ceph dashboard不支持直接在命令行里面创建用户的密码,所以需要.先创建一个包含用户密码的文件
# 创建密码文本
cat >/opt/secretkey<<EOF
123123
EOF
# 使用该文本作为密钥
ceph dashboard ac-user-create admin administrator -i /opt/secretkey
#administrator为管理员权限
Ceph Dashboard
创建完用户名密码,我们就可以访问mgr:7000 端口测试
mgr-dashboard可以设置多个节点,然后nginx upstream代理
[root@ceph-03 ~]# lsof -i:7000
COMMAND   PID USER   FD   TYPE DEVICE SIZE/OFF NODE NAME
ceph-mgr 9568 ceph   36u  IPv4 353517      0t0  TCP *:afs3-fileserver (LISTEN)
还可以使用ceph命令查看dashboard节点
[root@ceph-03 ~]# ceph mgr services
{
    "dashboard": "http://ceph-03:7000/"
}
访问ceph mgr ip:7000 端口
输入用户名密码

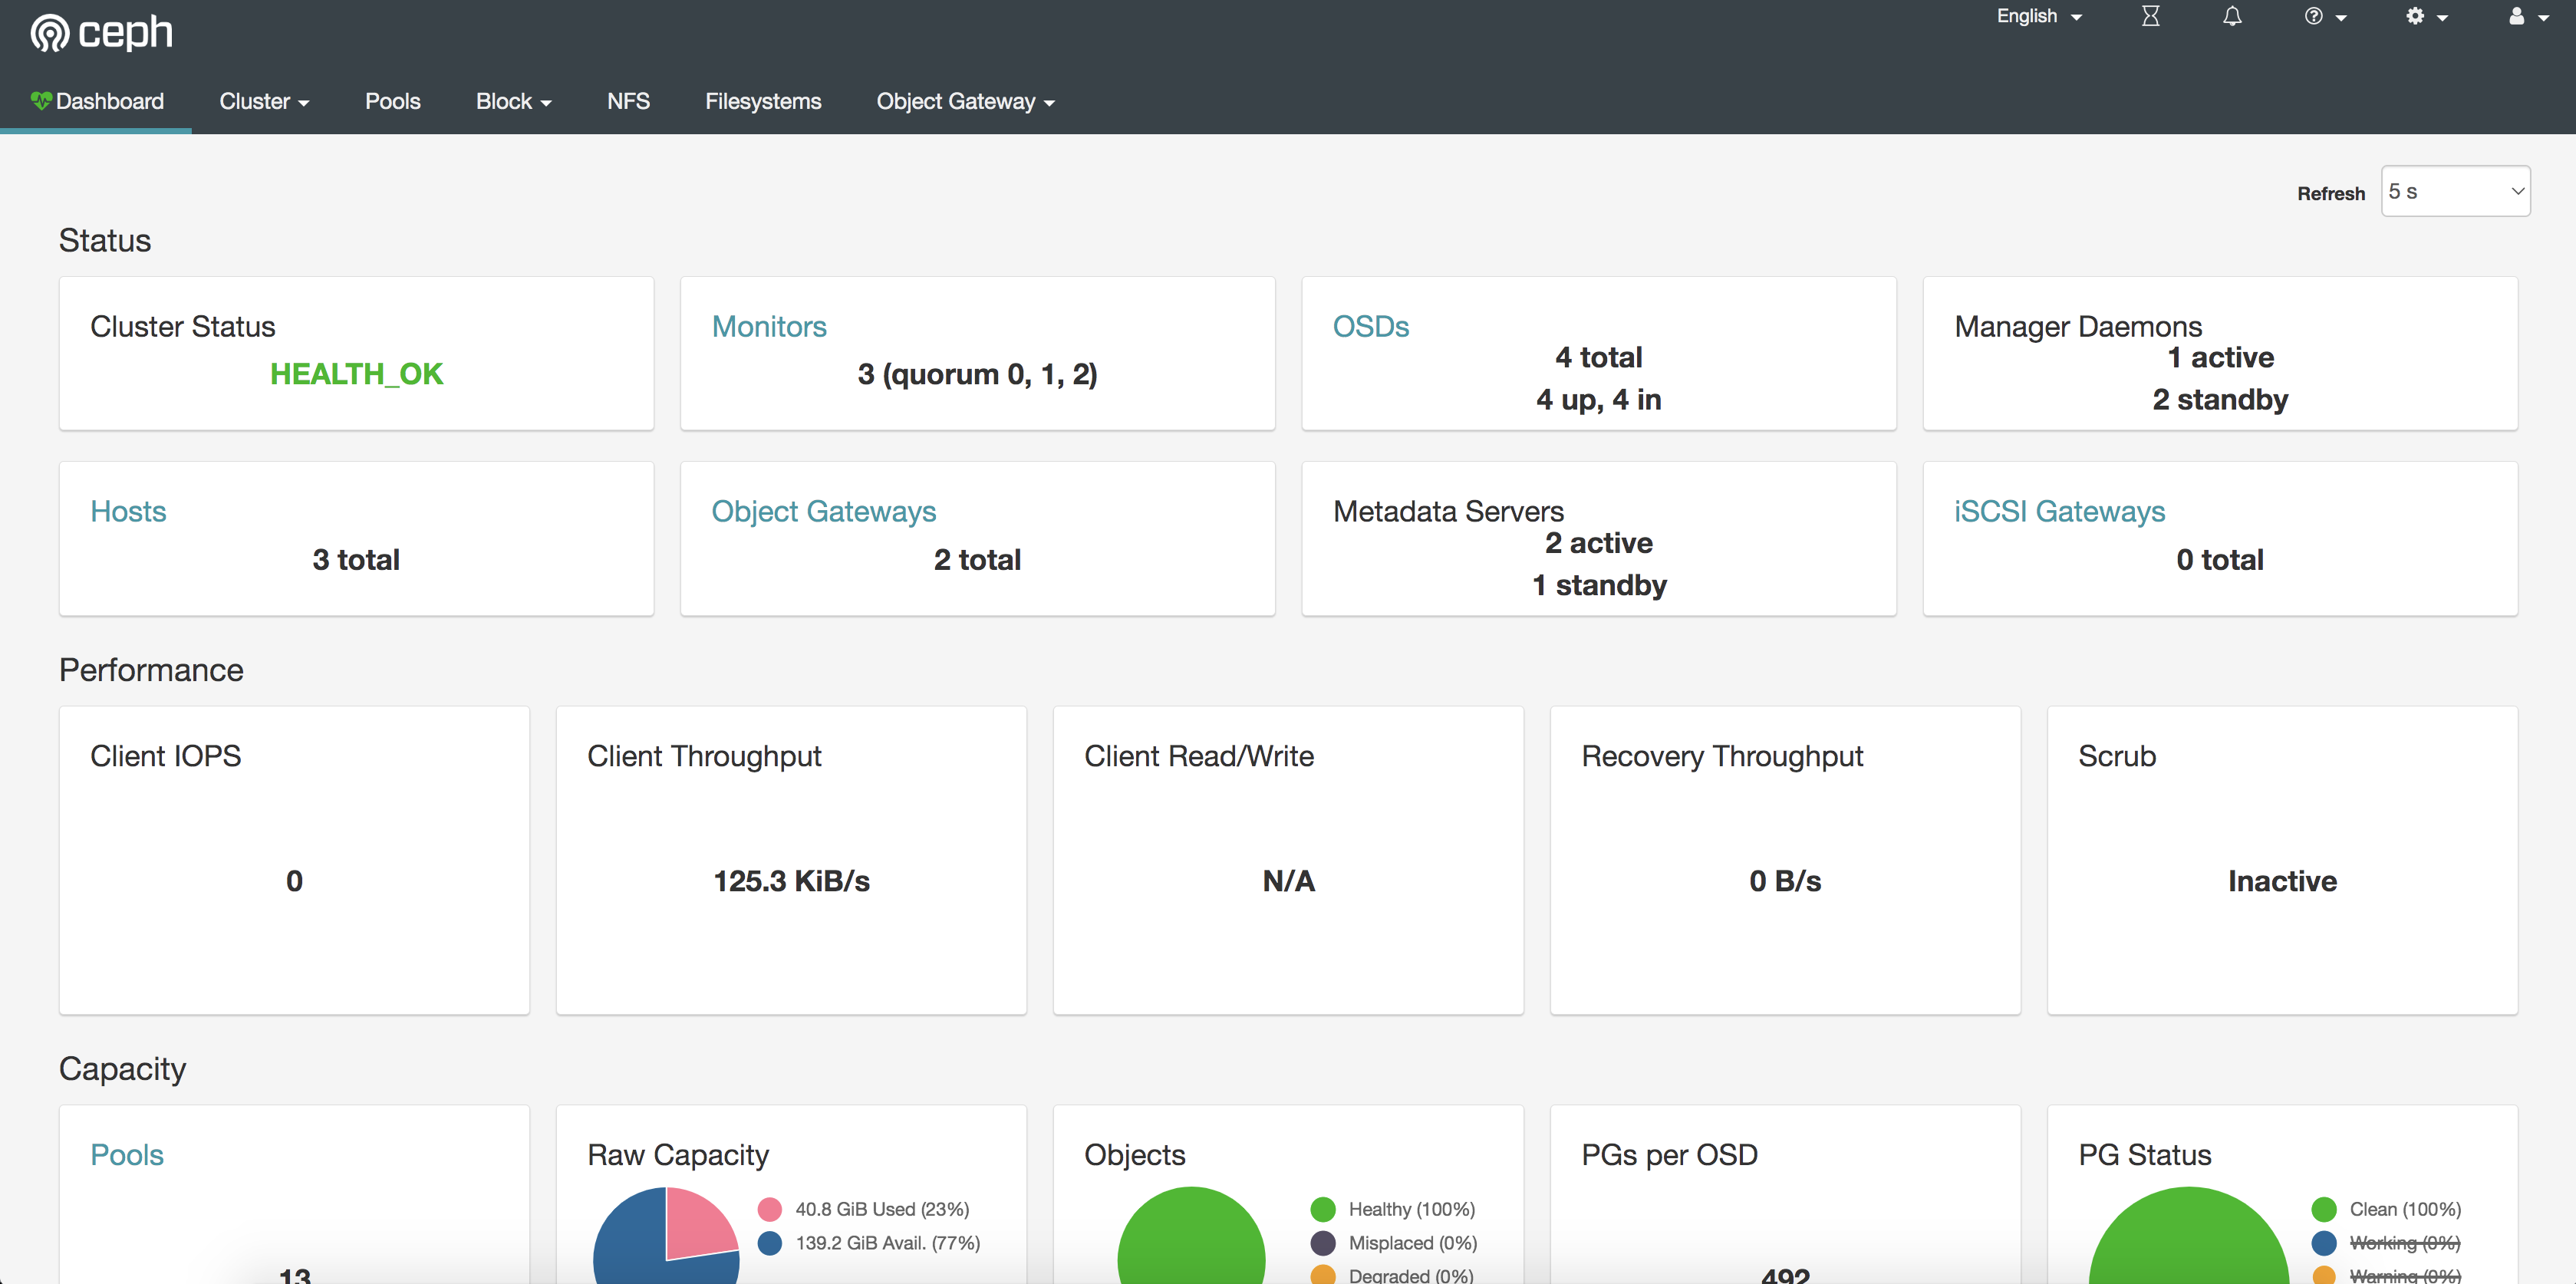
登陆成功后界面
Prometheus
Promethues相关知识可以参考,Docker版本安装

开启Prometheus metric模块
ceph mgr module enable prometheus默认ceph mgr metric端口为9283
[root@ceph-03 ~]# lsof -i:9283
COMMAND   PID USER   FD   TYPE DEVICE SIZE/OFF NODE NAME
ceph-mgr 9568 ceph   33u  IPv6 360155      0t0  TCP *:callwaveiam (LISTEN)

#测试metric
[root@ceph-03 ~]# curl 127.0.0.1:9283/metrics|head
# HELP ceph_mds_mem_dir_minus Directories closed
# TYPE ceph_mds_mem_dir_minus counter
ceph_mds_mem_dir_minus{ceph_daemon="mds.ceph-01"} 0.0
# HELP ceph_mds_mem_dir_plus Directories opened
# TYPE ceph_mds_mem_dir_plus counter
ceph_mds_mem_dir_plus{ceph_daemon="mds.ceph-01"} 12.0
# HELP ceph_osd_flag_norebalance OSD Flag norebalance
# TYPE ceph_osd_flag_norebalance untyped
ceph_osd_flag_norebalance 0.0
加入Prometheus监控
  - job_name: 'ceph-mgr'
    static_configs:
    - targets: ['82.157.142.150:7002']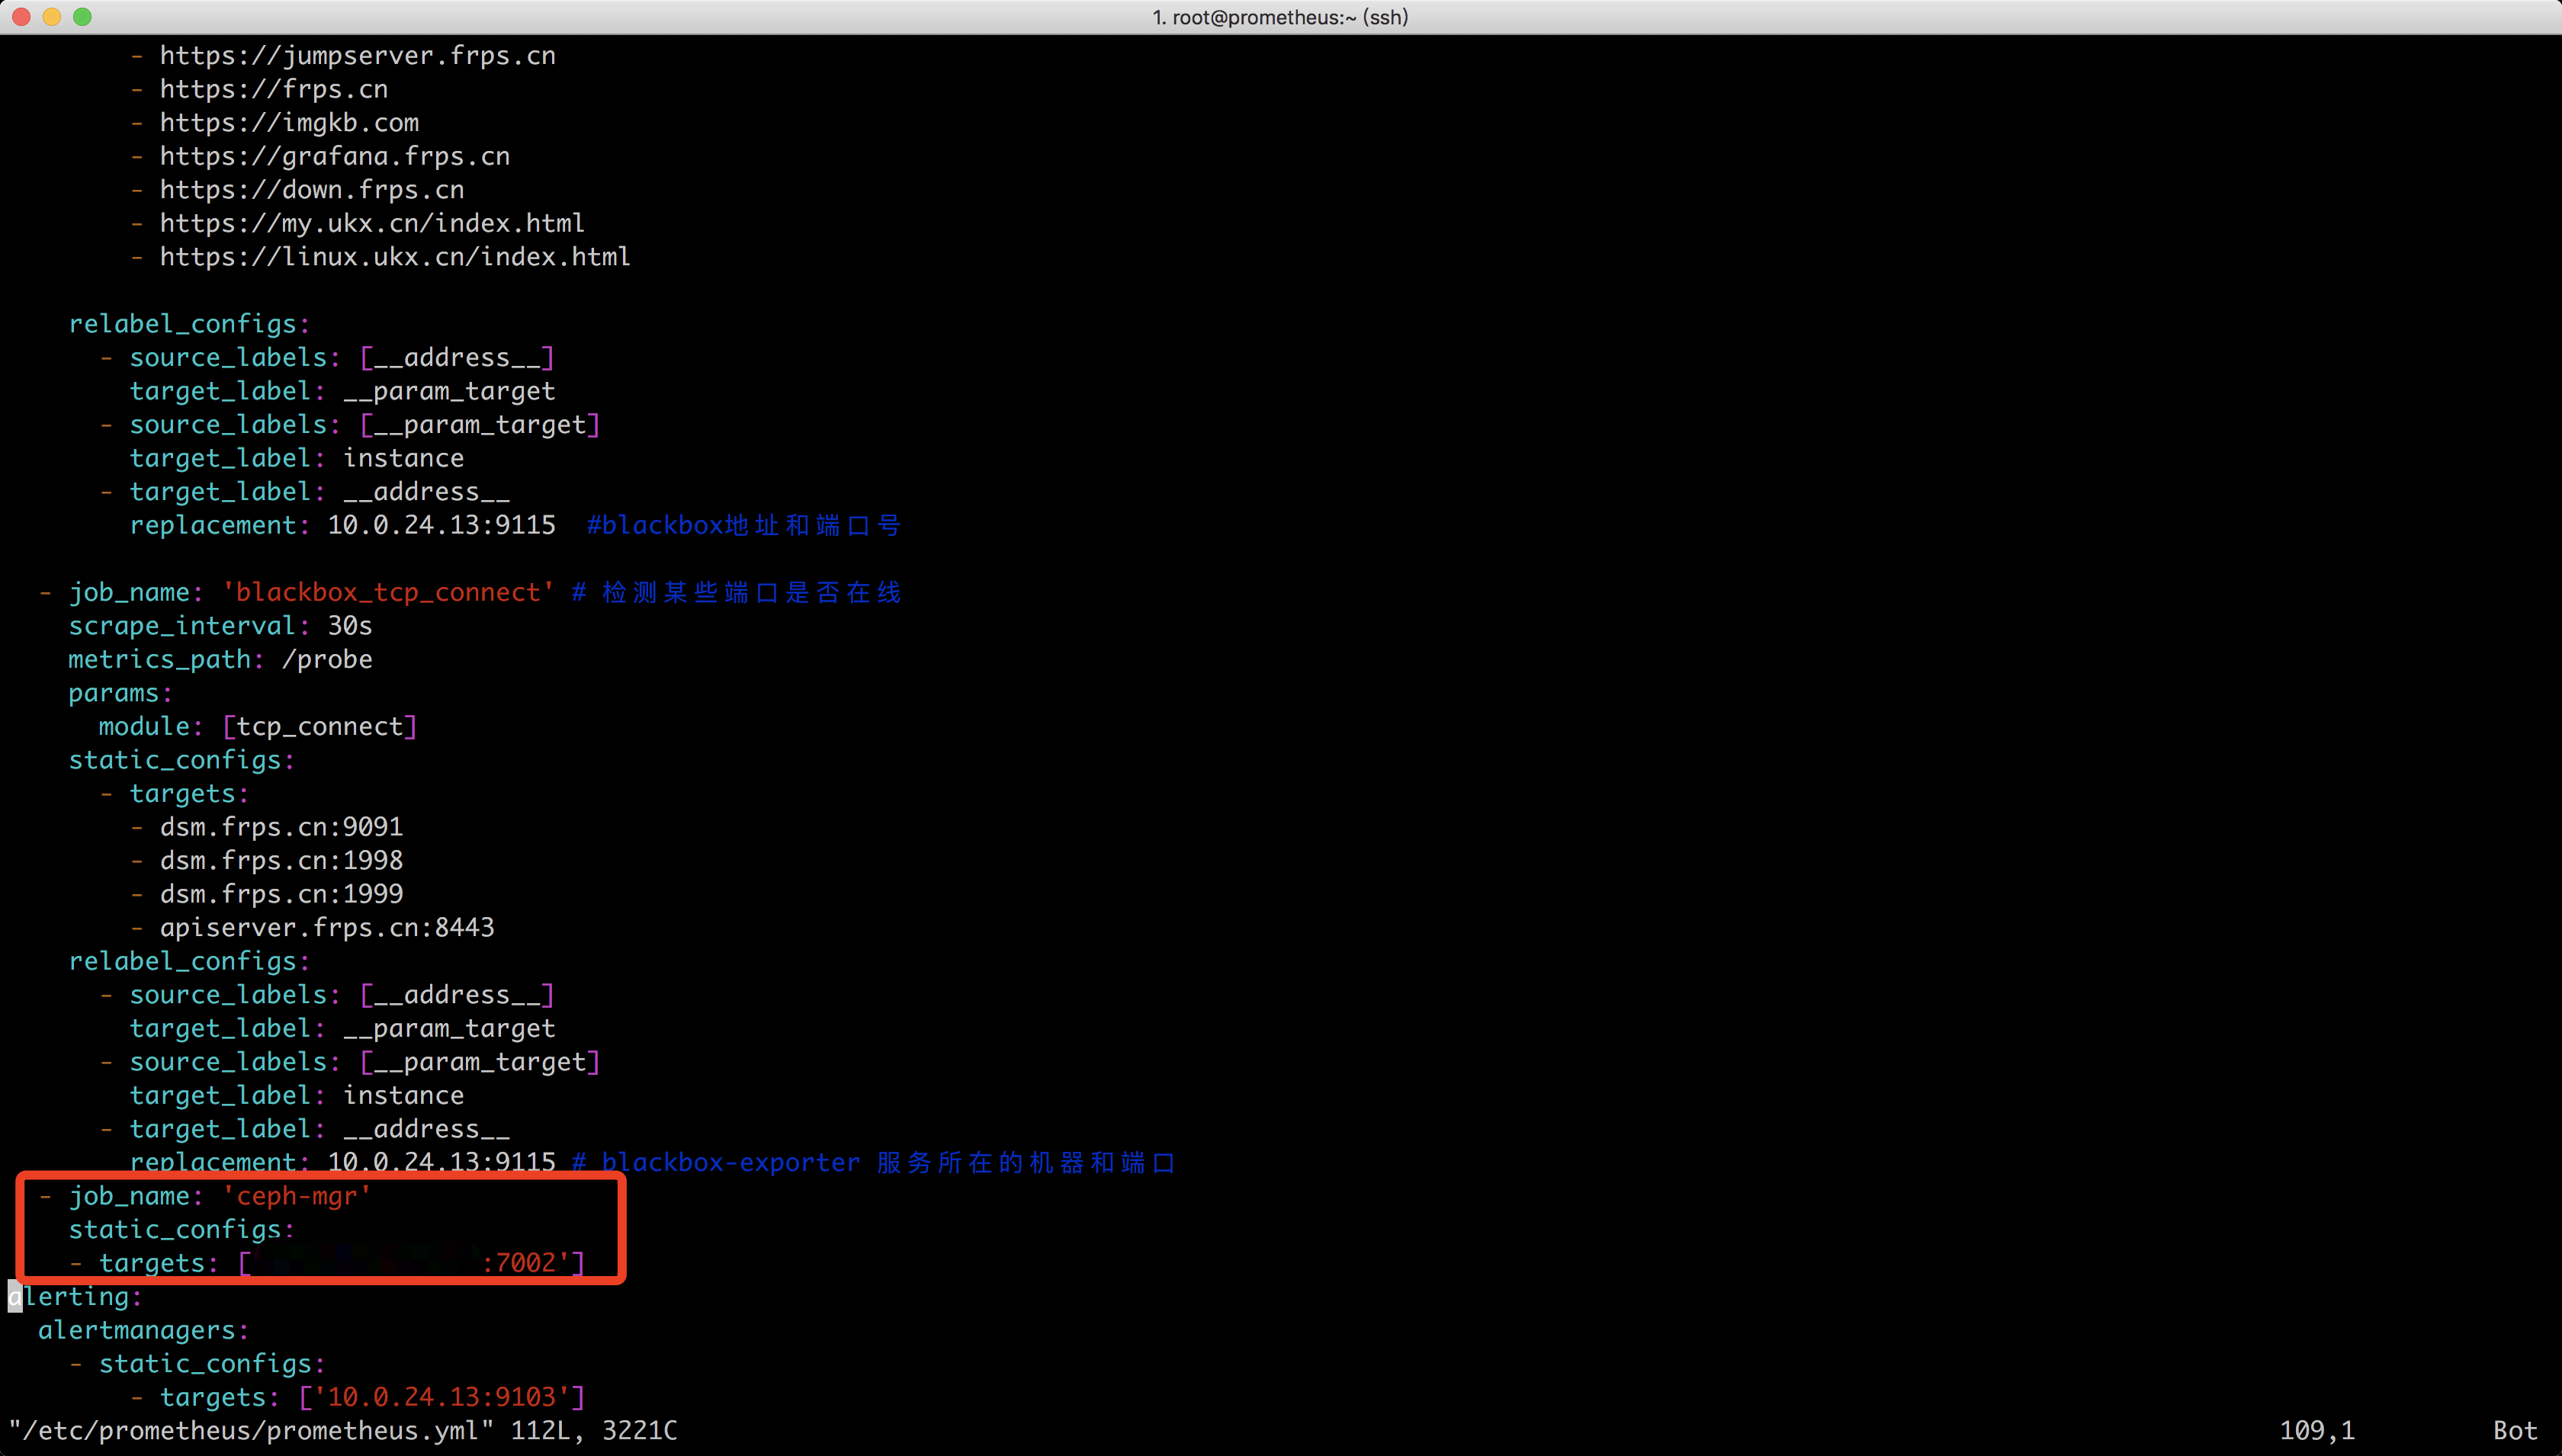
reload Prometheus,自行重启Prometheus
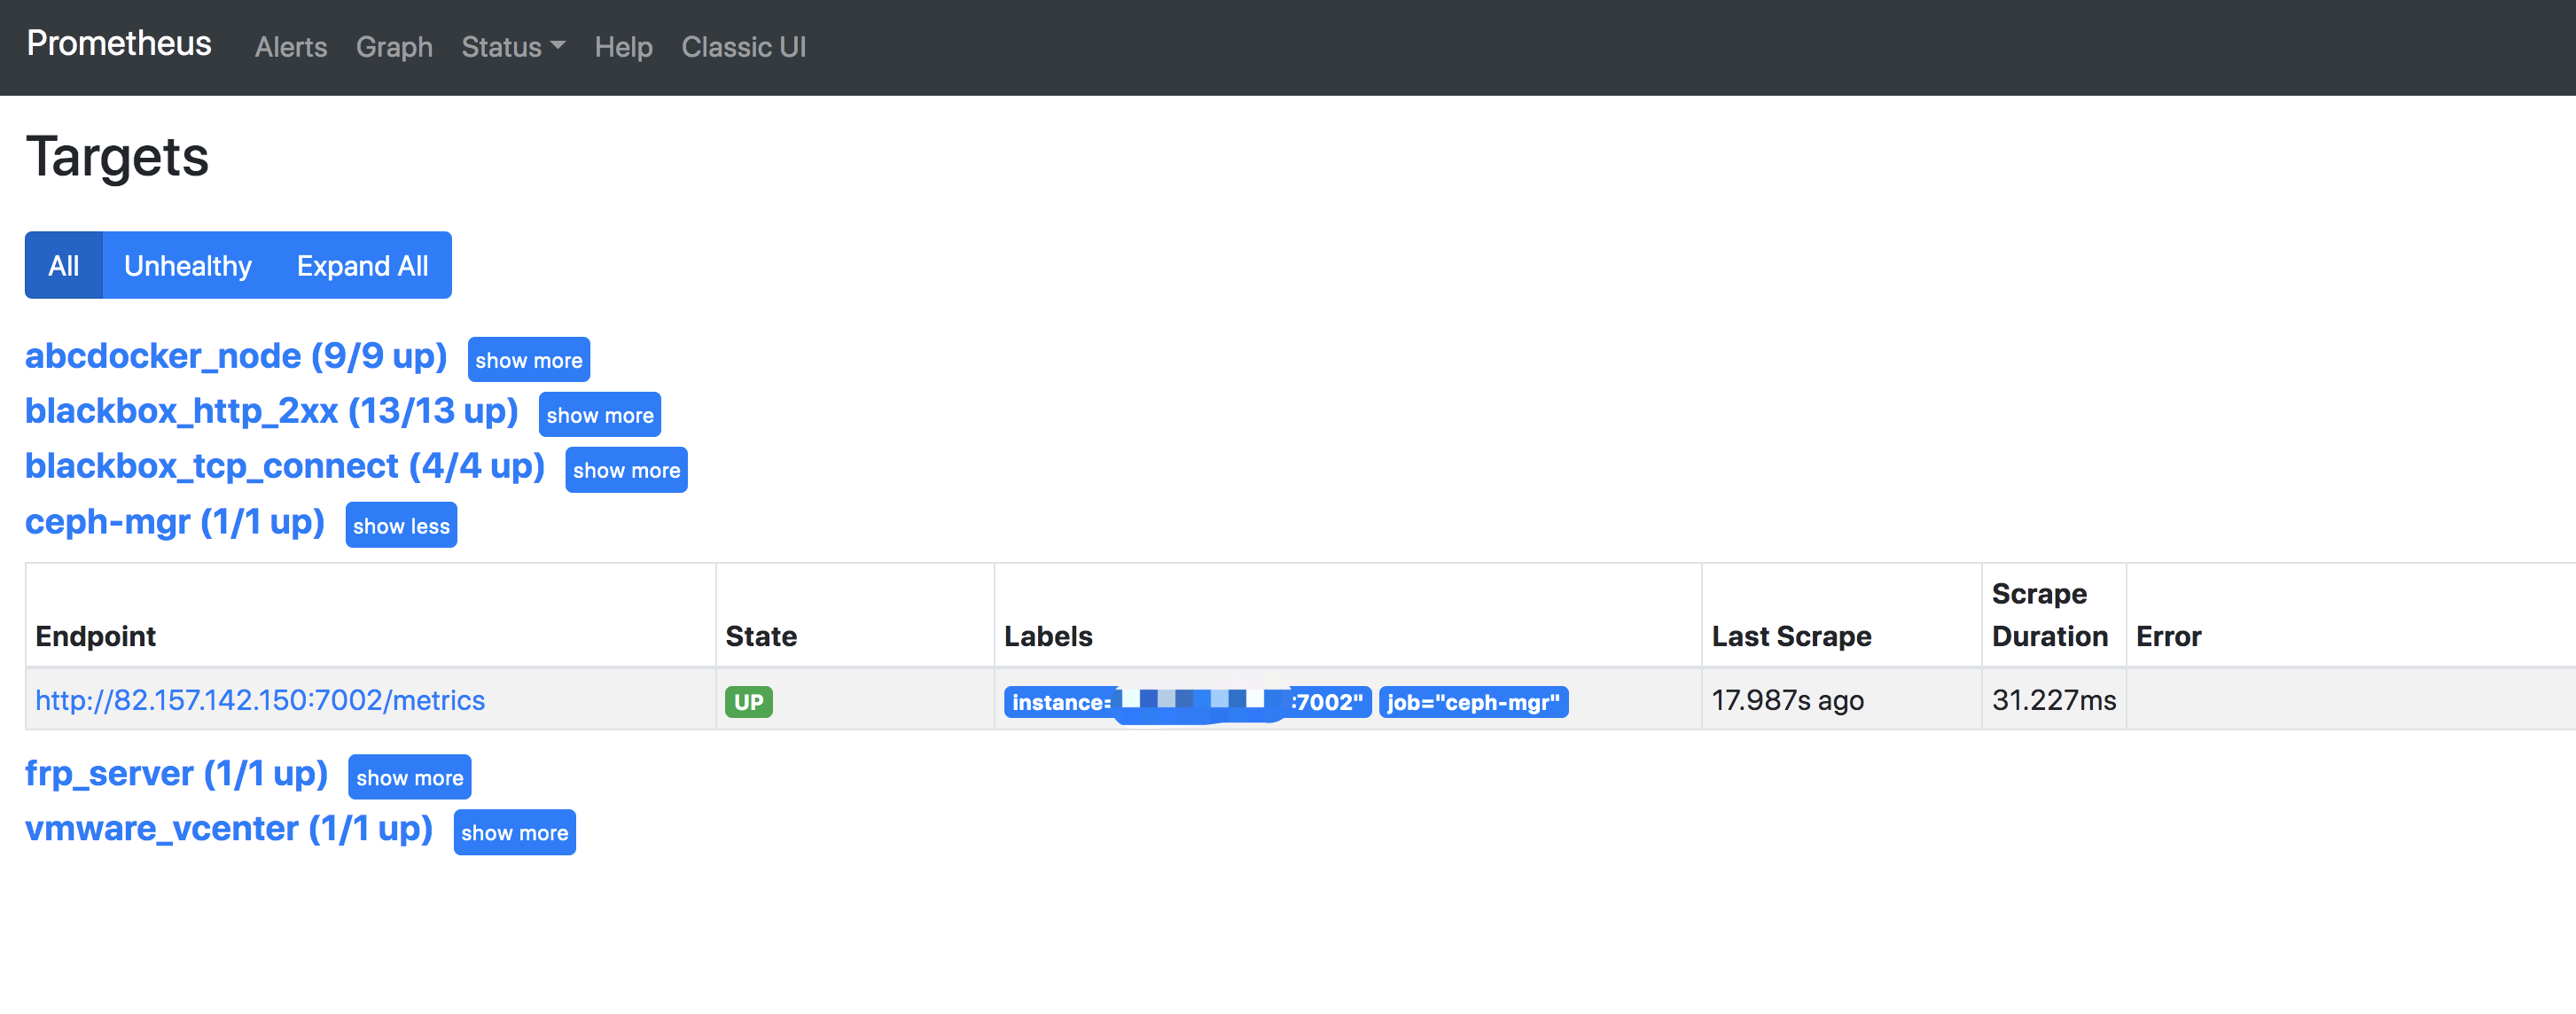
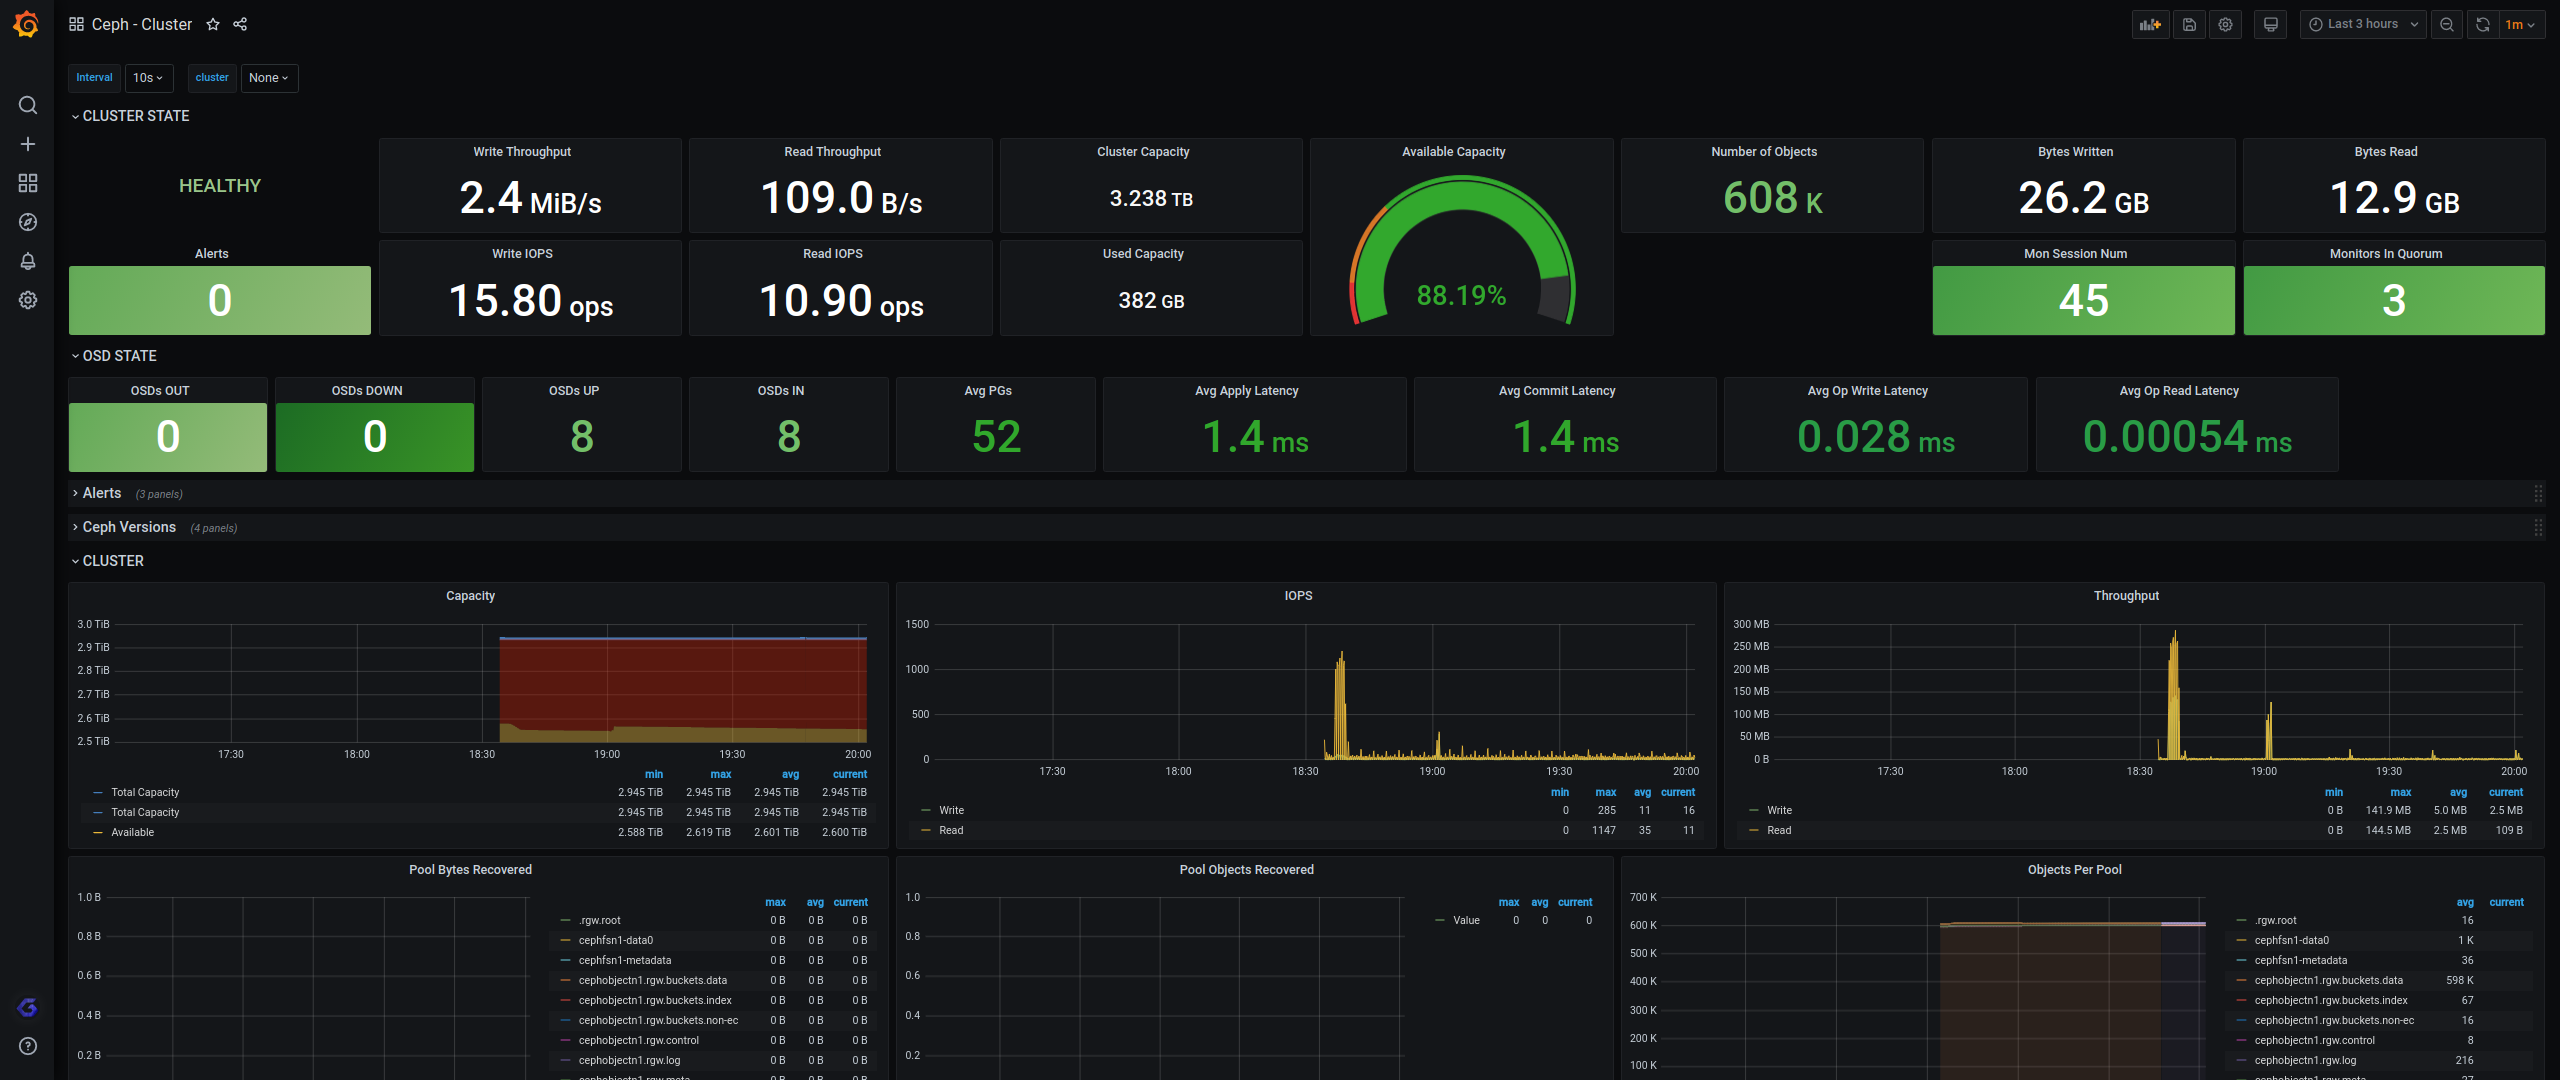
查看效果
AlertManager告警
监控项设置完了,我们设置一下ceph的告警规则
alertmanager搭建可以看下面的文章

[root@prometheus ~]# vim /etc/prometheus/rules/ceph_exporter.yaml

groups:
    - name: Ceph status
      rules:
      - alert: Ceph 实例不健康
        expr: ceph_health_status != 0
        for: 0m
        labels:
          severity: critical
        annotations:
          summary: Ceph 实例不健康{{ $labels.instance }})
          description: "Ceph instance unhealthyn  VALUE = {{ $value }}n  LABELS = {{ $labels }}"
      - alert: 检测到Ceph监视器时钟偏差
        expr: abs(ceph_monitor_clock_skew_seconds) > 0.2
        for: 2m
        labels:
          severity: warning
        annotations:
          summary: Ceph monitor clock skew (instance {{ $labels.instance }})
          description: "Ceph monitor clock skew detected. Please check ntp and hardware clock settingsn  VALUE = {{ $value     }}n  LABELS = {{ $labels }}"
      - alert: Ceph监视器存储空间不足
        expr: ceph_monitor_avail_percent < 10
        for: 2m
        labels:
          severity: warning
        annotations:
          summary: Ceph monitor low space (instance {{ $labels.instance }})
          description: "Ceph monitor storage is low.n  VALUE = {{ $value }}n  LABELS = {{ $labels }}"
      - alert: Ceph对象存储守护进程关闭
        expr: ceph_osd_up == 0
        for: 0m
        labels:
          severity: critical
        annotations:
          summary: Ceph OSD Down (instance {{ $labels.instance }})
          description: "Ceph Object Storage Daemon Downn  VALUE = {{ $value }}n  LABELS = {{ $labels }}"

      - alert: Ceph高OSD延迟
        expr: ceph_osd_perf_apply_latency_seconds > 5
        for: 1m
        labels:
          severity: warning
        annotations:
          summary: Ceph high OSD latency (instance {{ $labels.instance }})
          description: "Ceph Object Storage Daemon latency is high. Please check if it doesn't stuck in weird state.n  VALUE     = {{ $value }}n  LABELS = {{ $labels }}"

      - alert: CephOSD空间不足
        expr: ceph_osd_utilization > 90
        for: 2m
        labels:
          severity: warning
        annotations:
          summary: Ceph OSD low space (instance {{ $labels.instance }})
          description: "Ceph Object Storage Daemon is going out of space. Please add more disks.n  VALUE = {{ $value }}n      LABELS = {{ $labels }}"

      - alert: CephOSD重新加权
        expr: ceph_osd_weight < 1
        for: 2m
        labels:
          severity: warning
        annotations:
          summary: Ceph OSD reweighted (instance {{ $labels.instance }})
          description: "Ceph Object Storage Daemon takes too much time to resize.n  VALUE = {{ $value }}n  LABELS = {{     $labels }}"
      - alert: CephPG下降
        expr: ceph_pg_down > 0
        for: 0m
        labels:
          severity: critical
        annotations:
          summary: Ceph PG down (instance {{ $labels.instance }})
          description: "Some Ceph placement groups are down. Please ensure that all the data are available.n  VALUE = {{     $value }}n  LABELS = {{ $labels }}"
      - alert: CephPG不完整
        expr: ceph_pg_incomplete > 0
        for: 0m
        labels:
          severity: critical
        annotations:
          summary: Ceph PG incomplete (instance {{ $labels.instance }})
          description: "Some Ceph placement groups are incomplete. Please ensure that all the data are available.n  VALUE =     {{ $value }}n  LABELS = {{ $labels }}"
      - alert: CephPG不一致
        expr: ceph_pg_inconsistent > 0
        for: 0m
        labels:
          severity: warning
        annotations:
          summary: Ceph PG inconsistent (instance {{ $labels.instance }})
          description: "Some Ceph placement groups are inconsistent. Data is available but inconsistent across nodes.n  VALUE     = {{ $value }}n  LABELS = {{ $labels }}"
      - alert: CephPG激活时间长
        expr: ceph_pg_activating > 0
        for: 2m
        labels:
          severity: warning
        annotations:
          summary: Ceph PG activation long (instance {{ $labels.instance }})
          description: "Some Ceph placement groups are too long to activate.n  VALUE = {{ $value }}n  LABELS = {{ $labels }}"
      - alert: Ceph PG回填已满
        expr: ceph_pg_backfill_toofull > 0
        for: 2m
        labels:
          severity: warning
        annotations:
          summary: Ceph PG backfill full (instance {{ $labels.instance }})
          description: "Some Ceph placement groups are located on full Object Storage Daemon on cluster. Those PGs can be     unavailable shortly. Please check OSDs, change weight or reconfigure CRUSH rules.n  VALUE = {{ $value }}n  LABELS     = {{ $labels }}"
      - alert: Ceph PG不可用
        expr: ceph_pg_total - ceph_pg_active > 0
        for: 0m
        labels:
          severity: critical
        annotations:
          summary: Ceph PG unavailable (instance {{ $labels.instance }})
          description: "Some Ceph placement groups are unavailable.n  VALUE = {{ $value }}n  LABELS = {{ $labels }}"
重启Prometheus和alertmanager
[root@prometheus ~]# docker restart prometheus_new
prometheus_new
[root@prometheus ~]# docker restart alertmanager
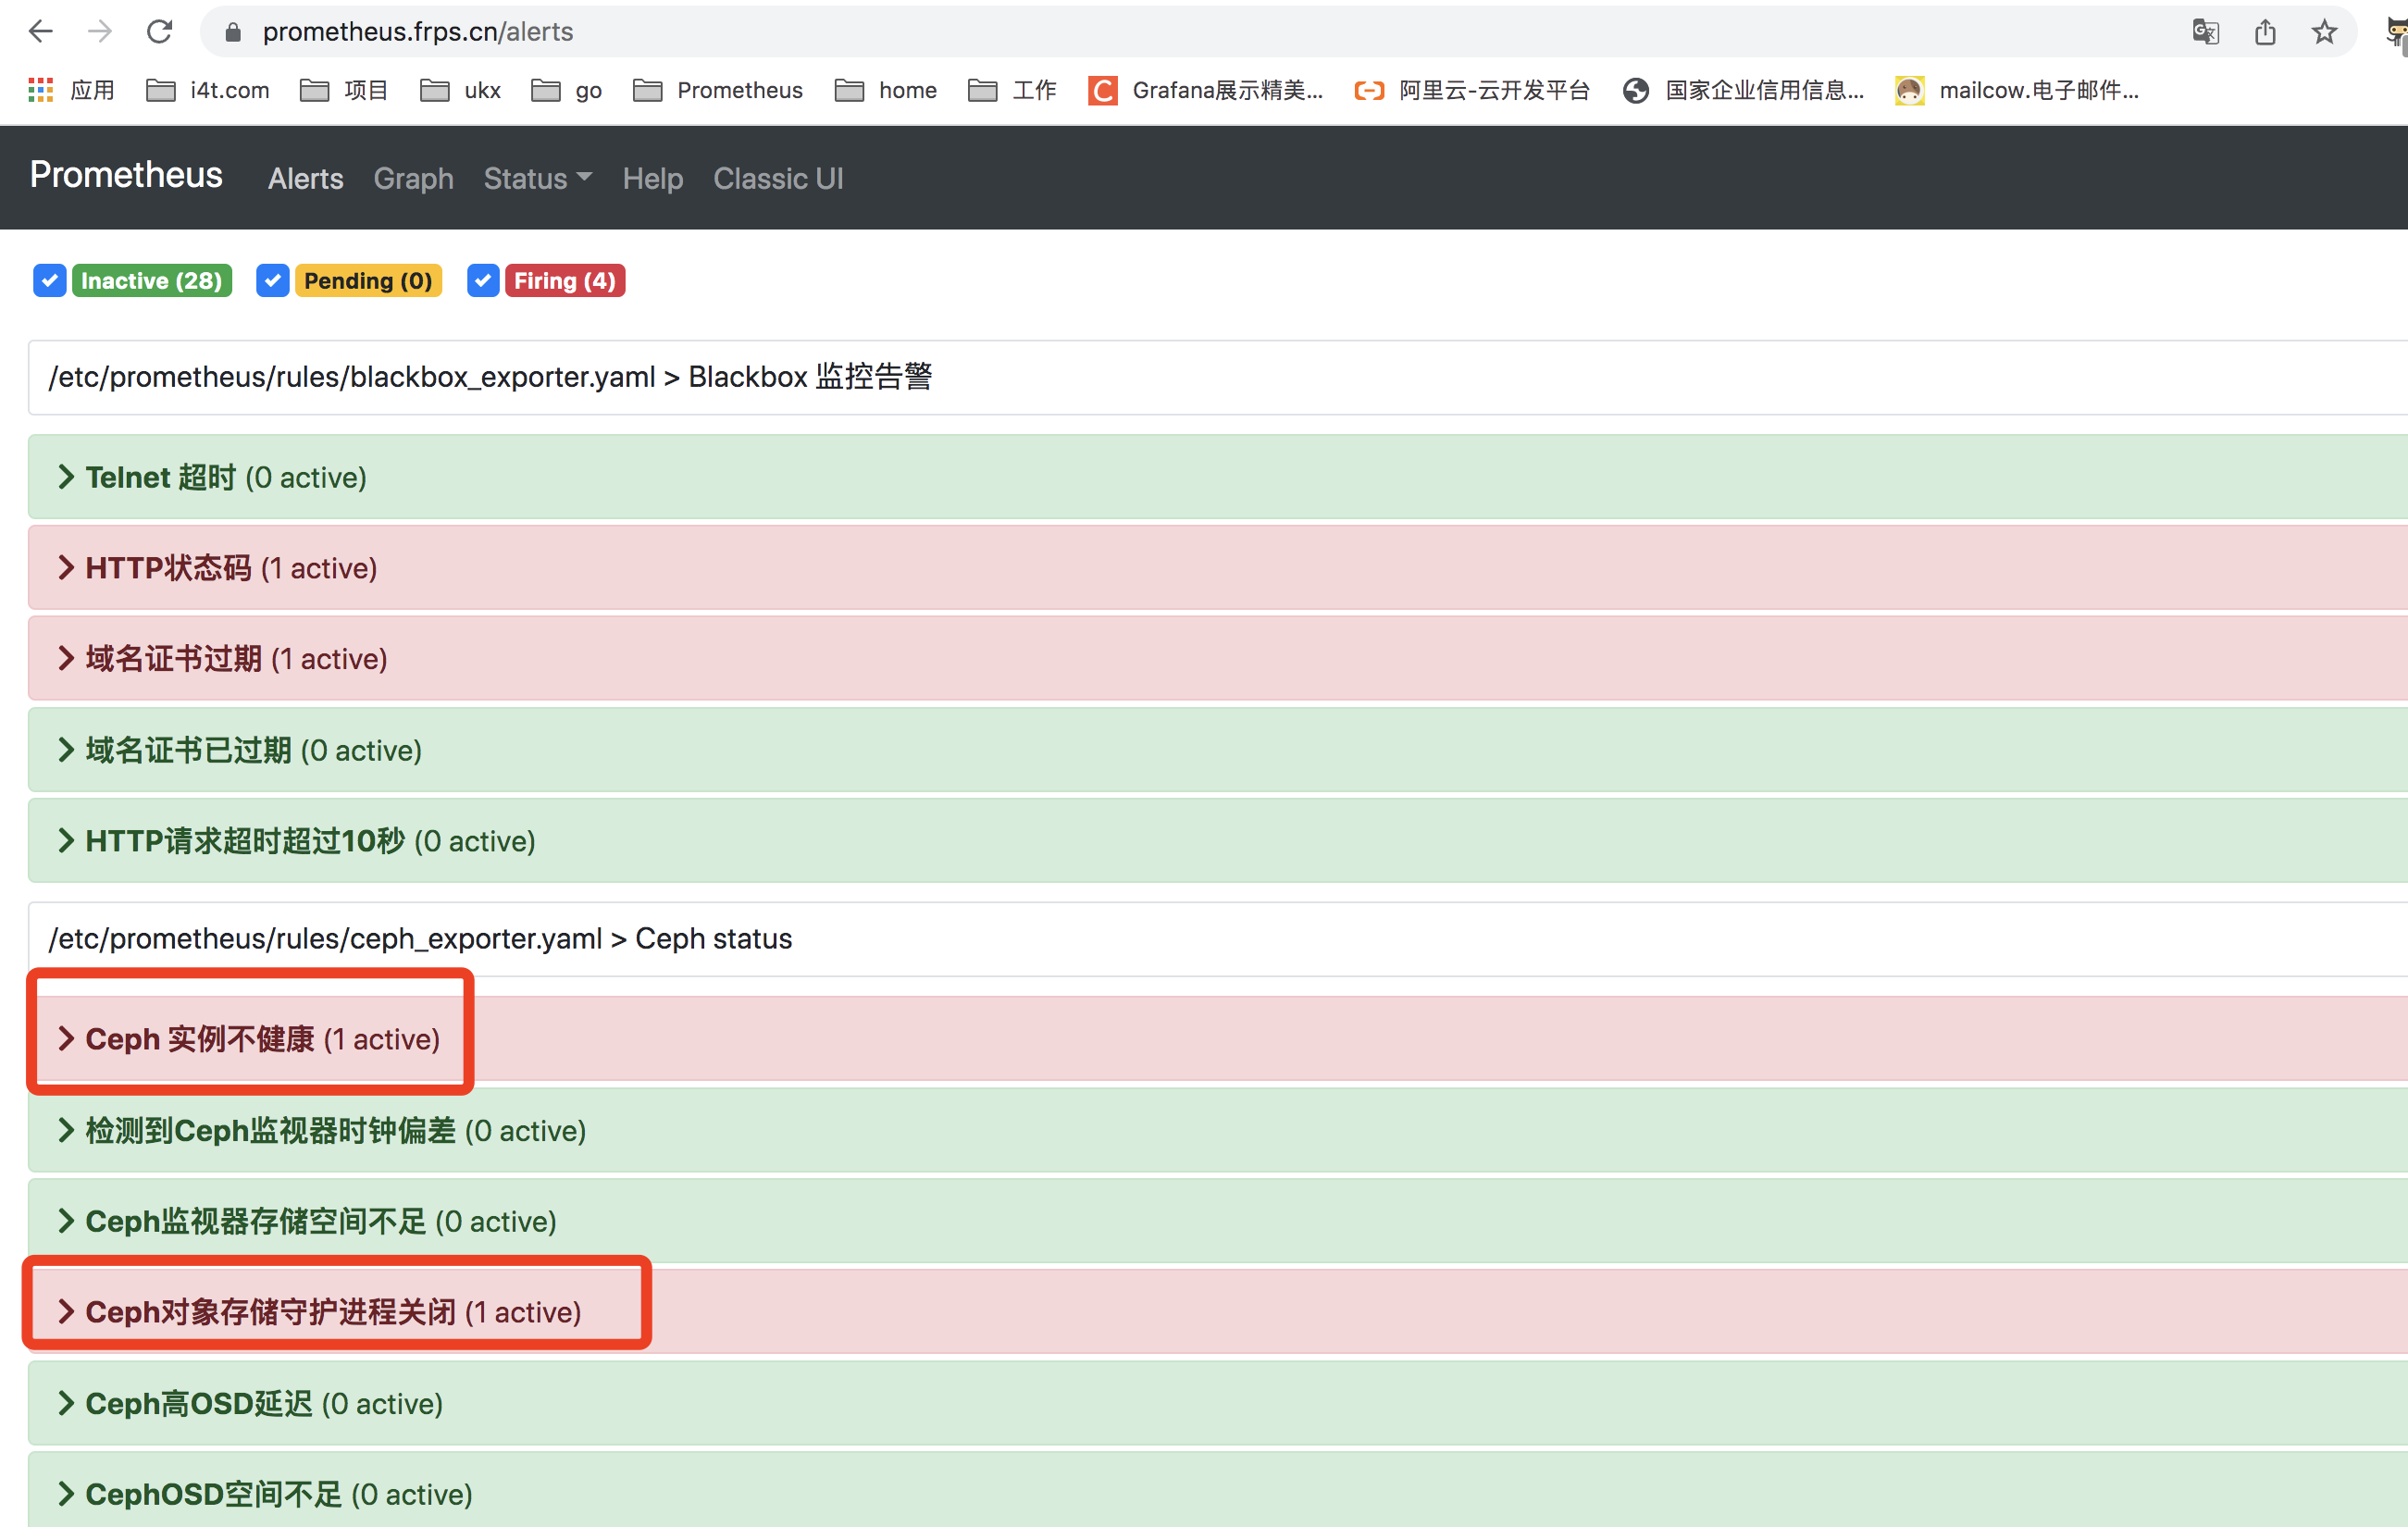
alertmanager进入Prometheus就可以看到alert,看到ceph 告警信息
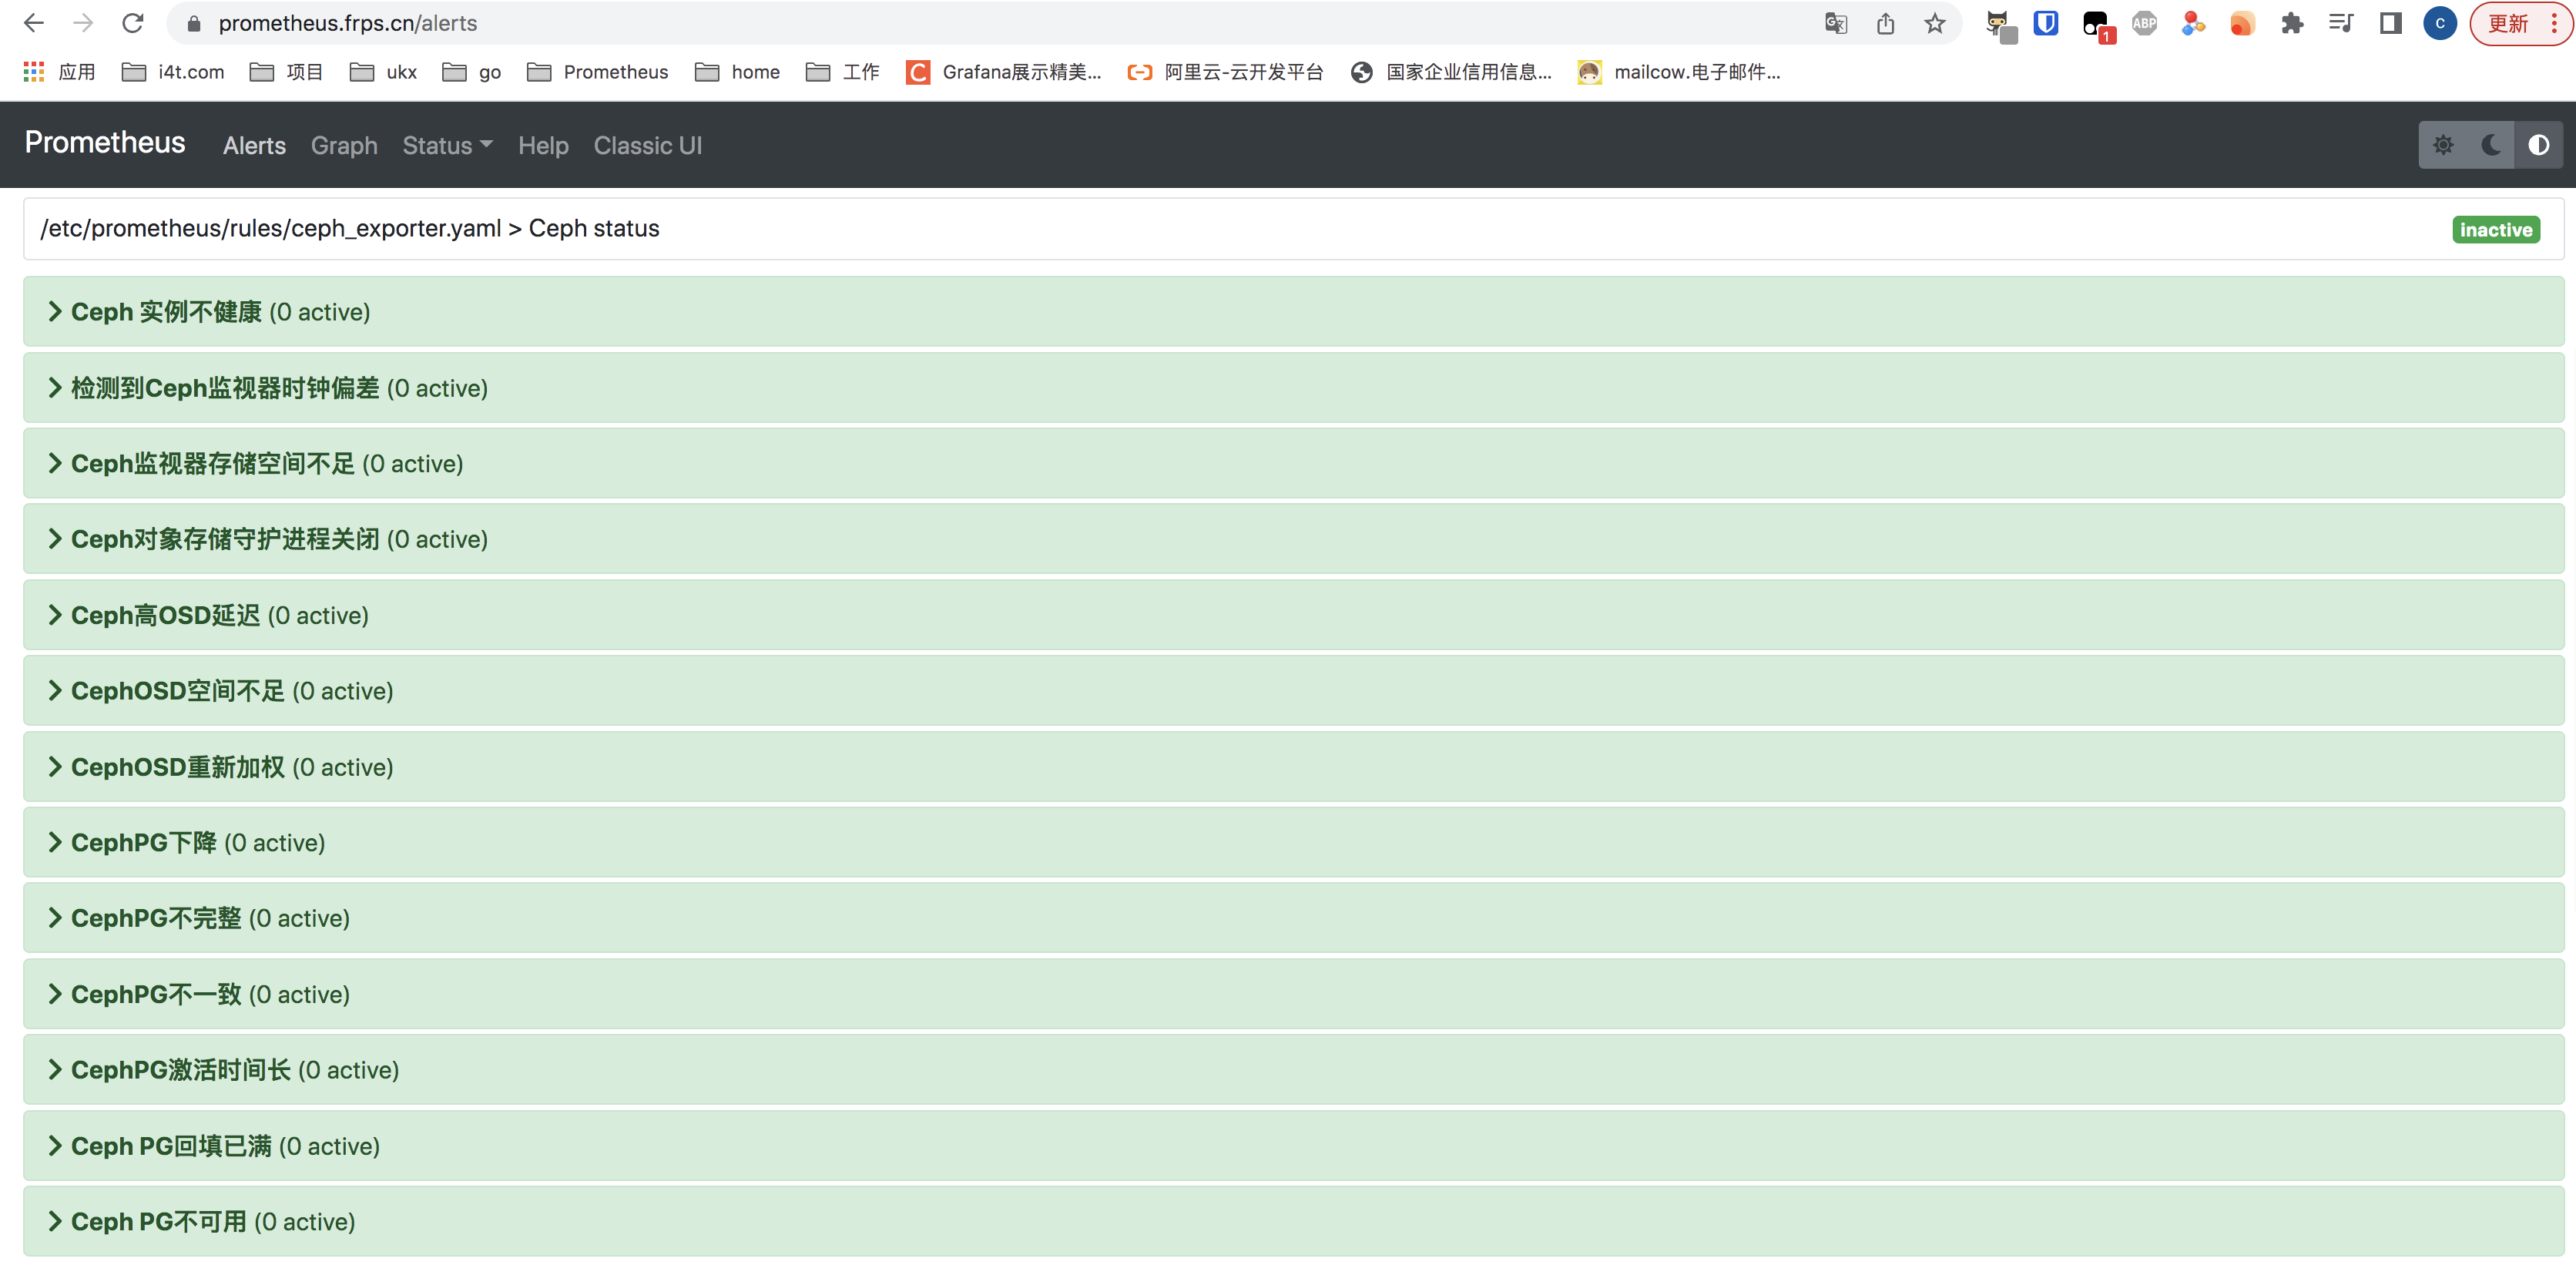
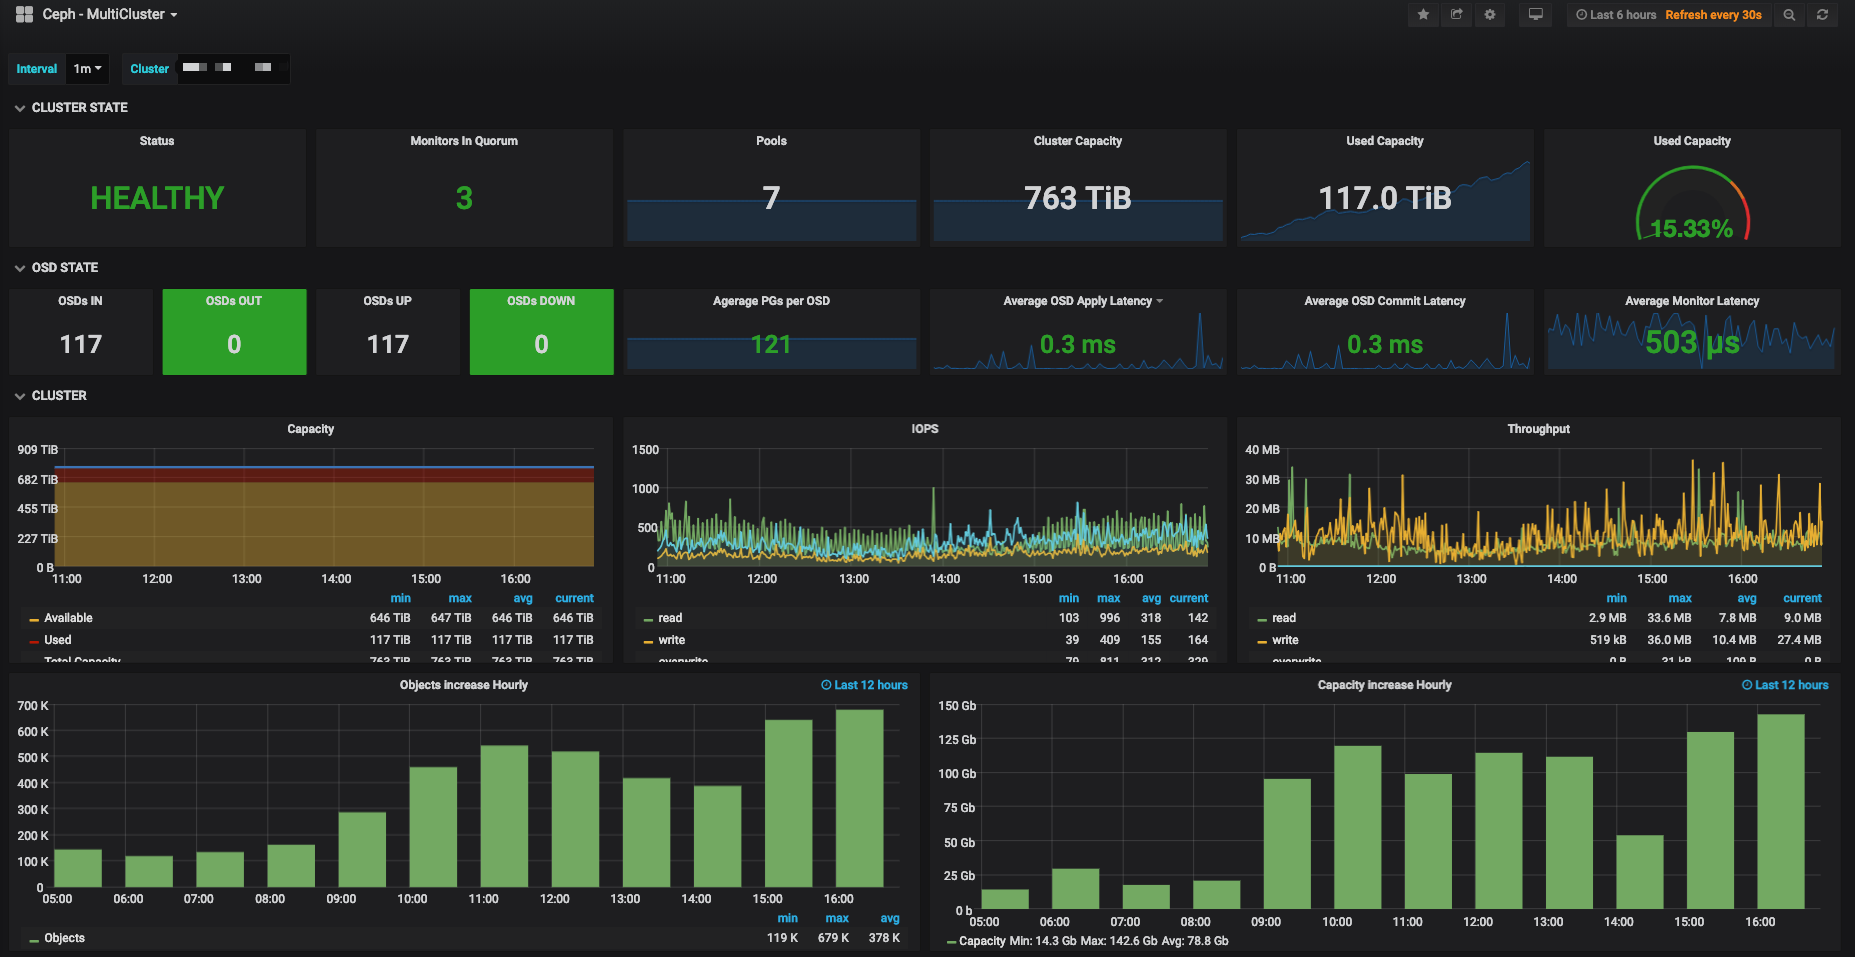
Grafana
Grafana Docker安装
Grafana上传模板
#我提供的grafana下载地址
wget https://d.frps.cn/file/tools/grafana/ceph/ceph-cluster_rev1.json
#将这个json下载下来

#windows下载
https://d.frps.cn/?tools/grafana/ceph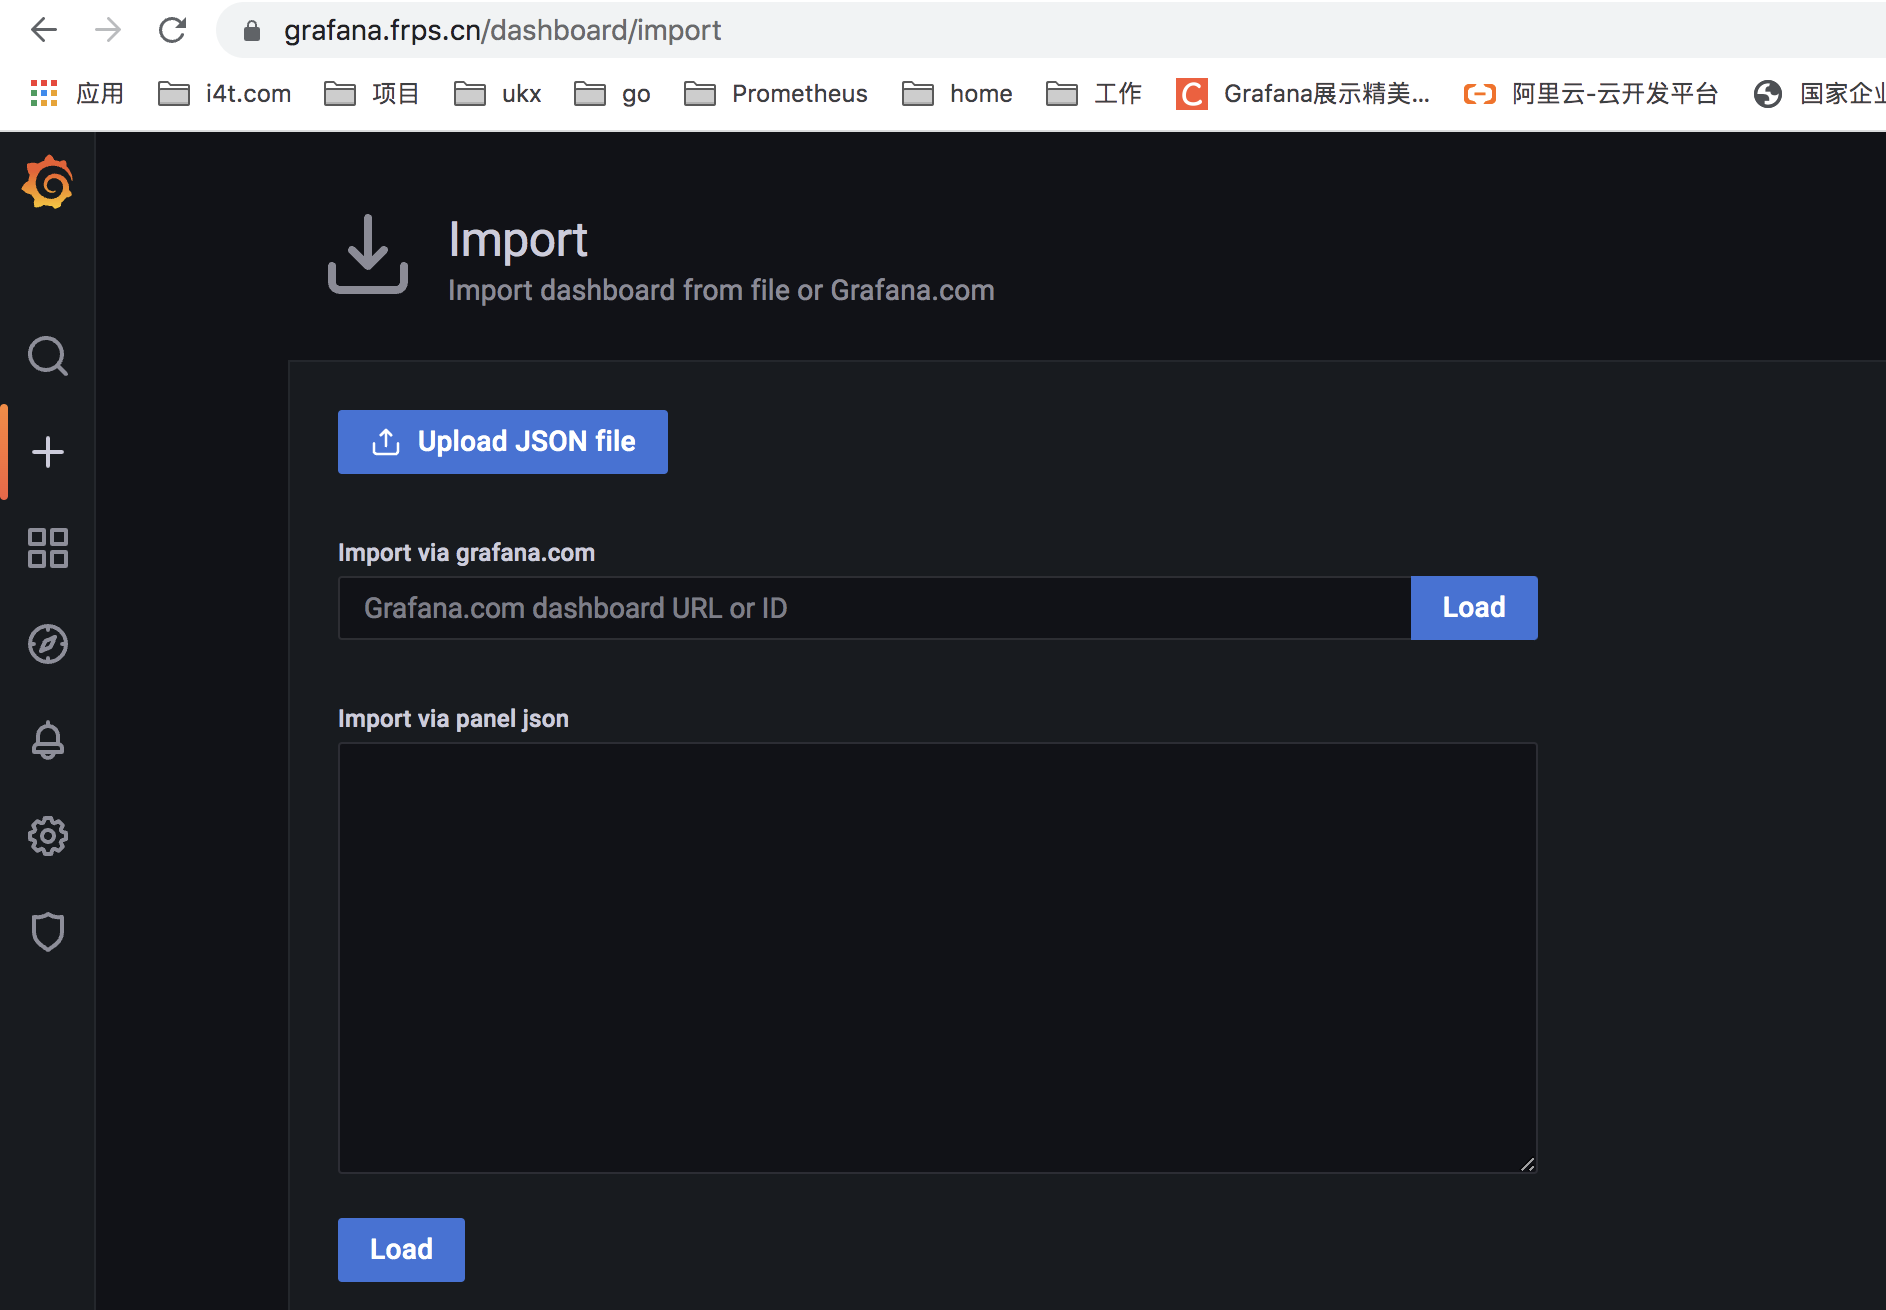
手动上传json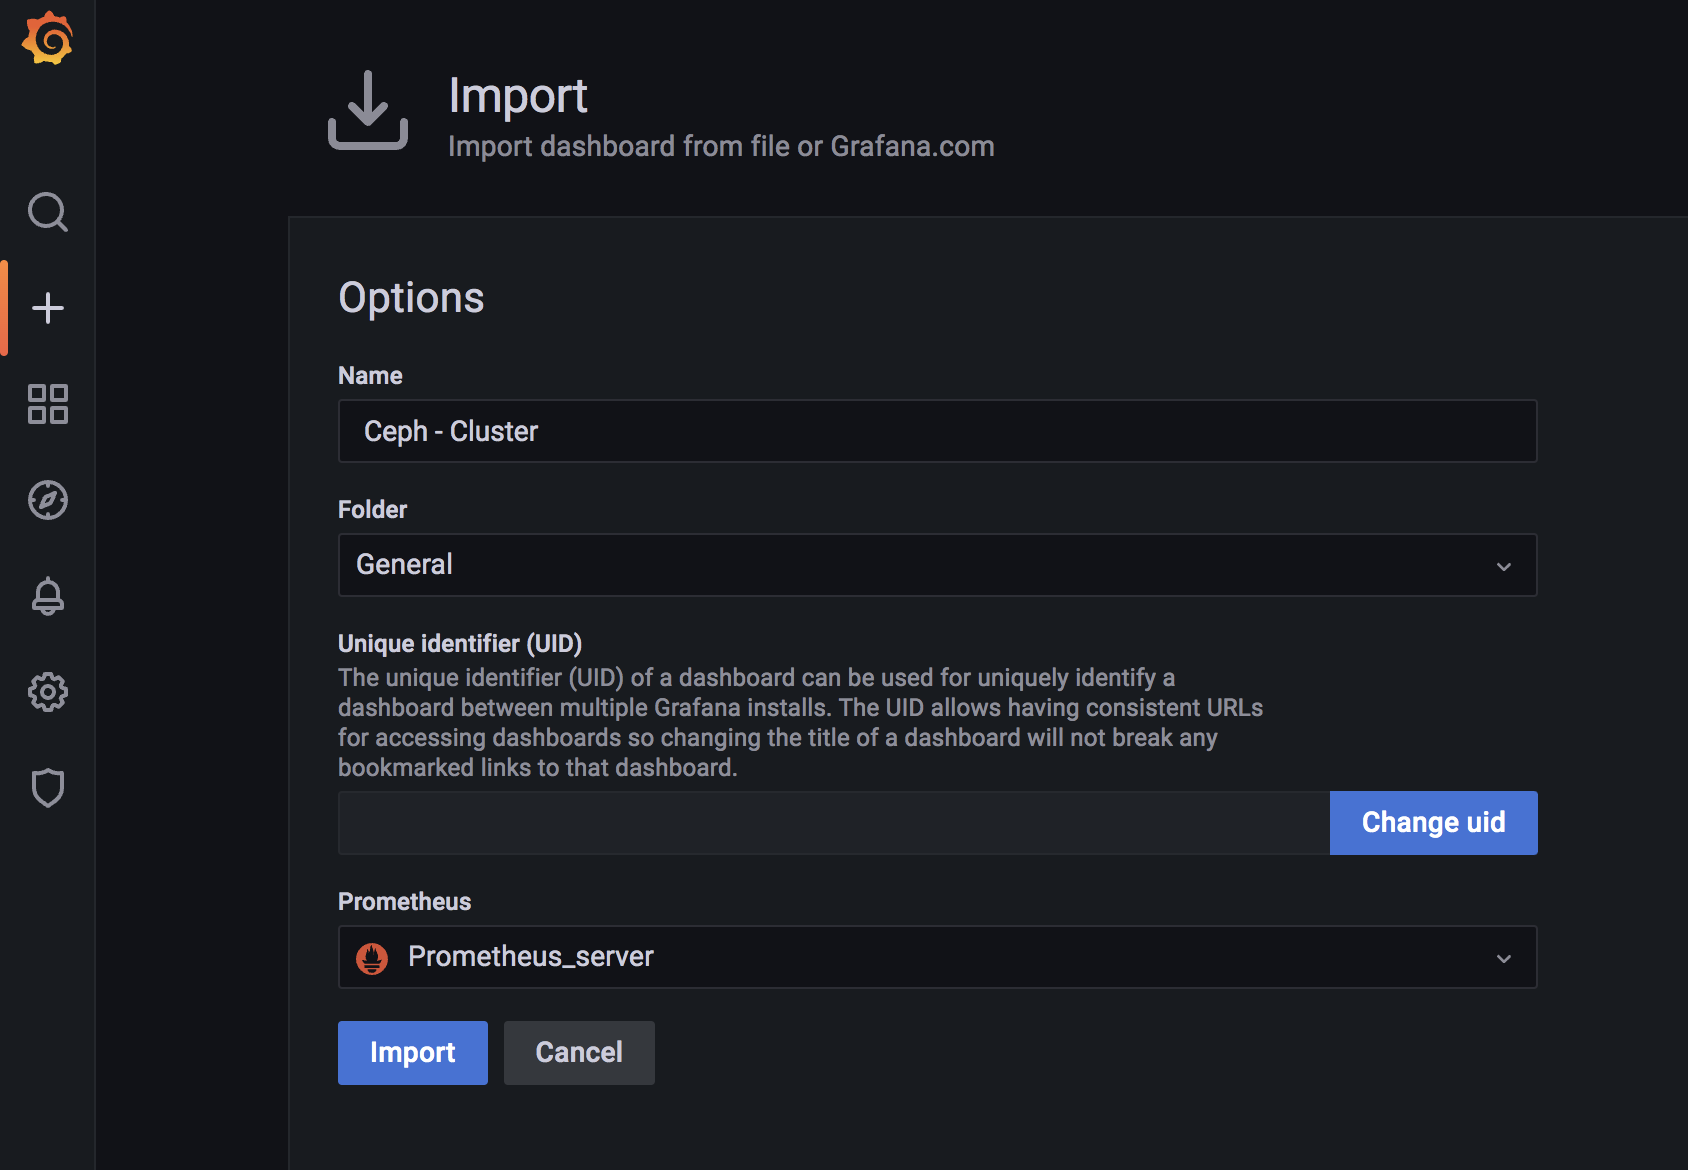
或者使用这个id2842
https://grafana.com/grafana/dashboards/2842
9966也可以使用
告警测试
我们将ceph-02重启,检查是否可以告警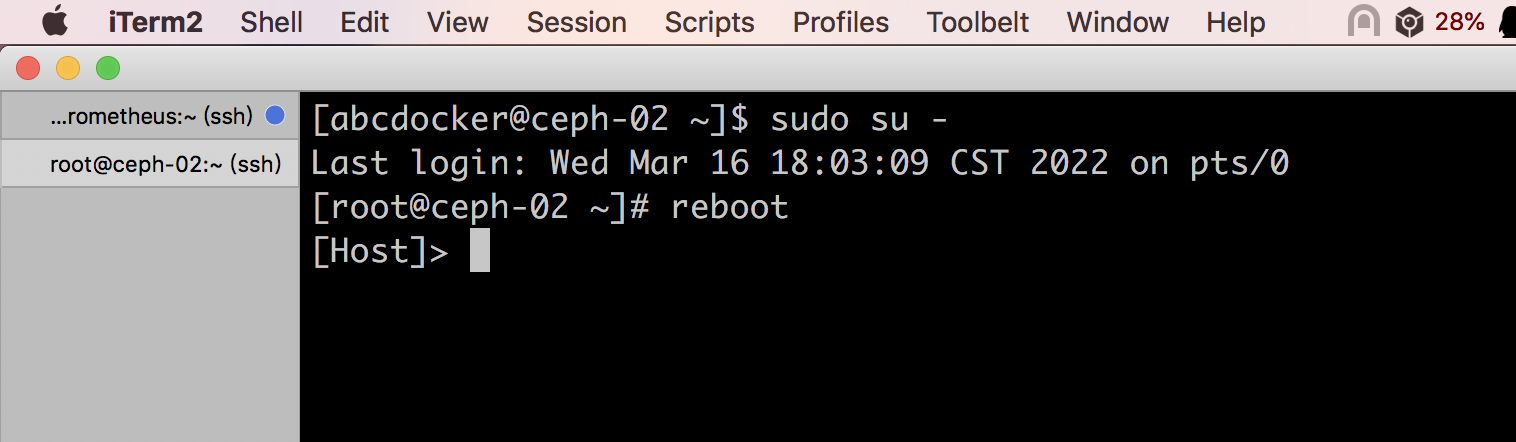
ceph状态已经异常
[root@ceph-01 ~]# ceph -s
  cluster:
    id:     c8ae7537-8693-40df-8943-733f82049642
    health: HEALTH_WARN
            1 filesystem is degraded
            insufficient standby MDS daemons available
            1 osds down
            1 host (1 osds) down
            Degraded data redundancy: 3803/11409 objects degraded (33.333%), 330 pgs degraded
            1/3 mons down, quorum ceph-01,ceph-03

  services:
    mon: 3 daemons, quorum ceph-01,ceph-03 (age 16s), out of quorum: ceph-02
    mgr: ceph-03(active, since 40m), standbys: ceph-01, ceph-02
    mds: cephfs-abcdocker:1 cephfs:1/1 {cephfs-abcdocker:0=ceph-01=up:active,cephfs:0=ceph-03=up:replay}
    osd: 4 osds: 3 up (since 15s), 4 in (since 3w)
    rgw: 1 daemon active (ceph-01)

  task status:

  data:
    pools:   13 pools, 656 pgs
    objects: 3.80k objects, 13 GiB
    usage:   41 GiB used, 139 GiB / 180 GiB avail
    pgs:     3803/11409 objects degraded (33.333%)
             330 active+undersized+degraded
             326 active+undersized

  io:
    client:   115 KiB/s wr, 0 op/s rd, 3 op/s wr
Prometheus 已经提示告警
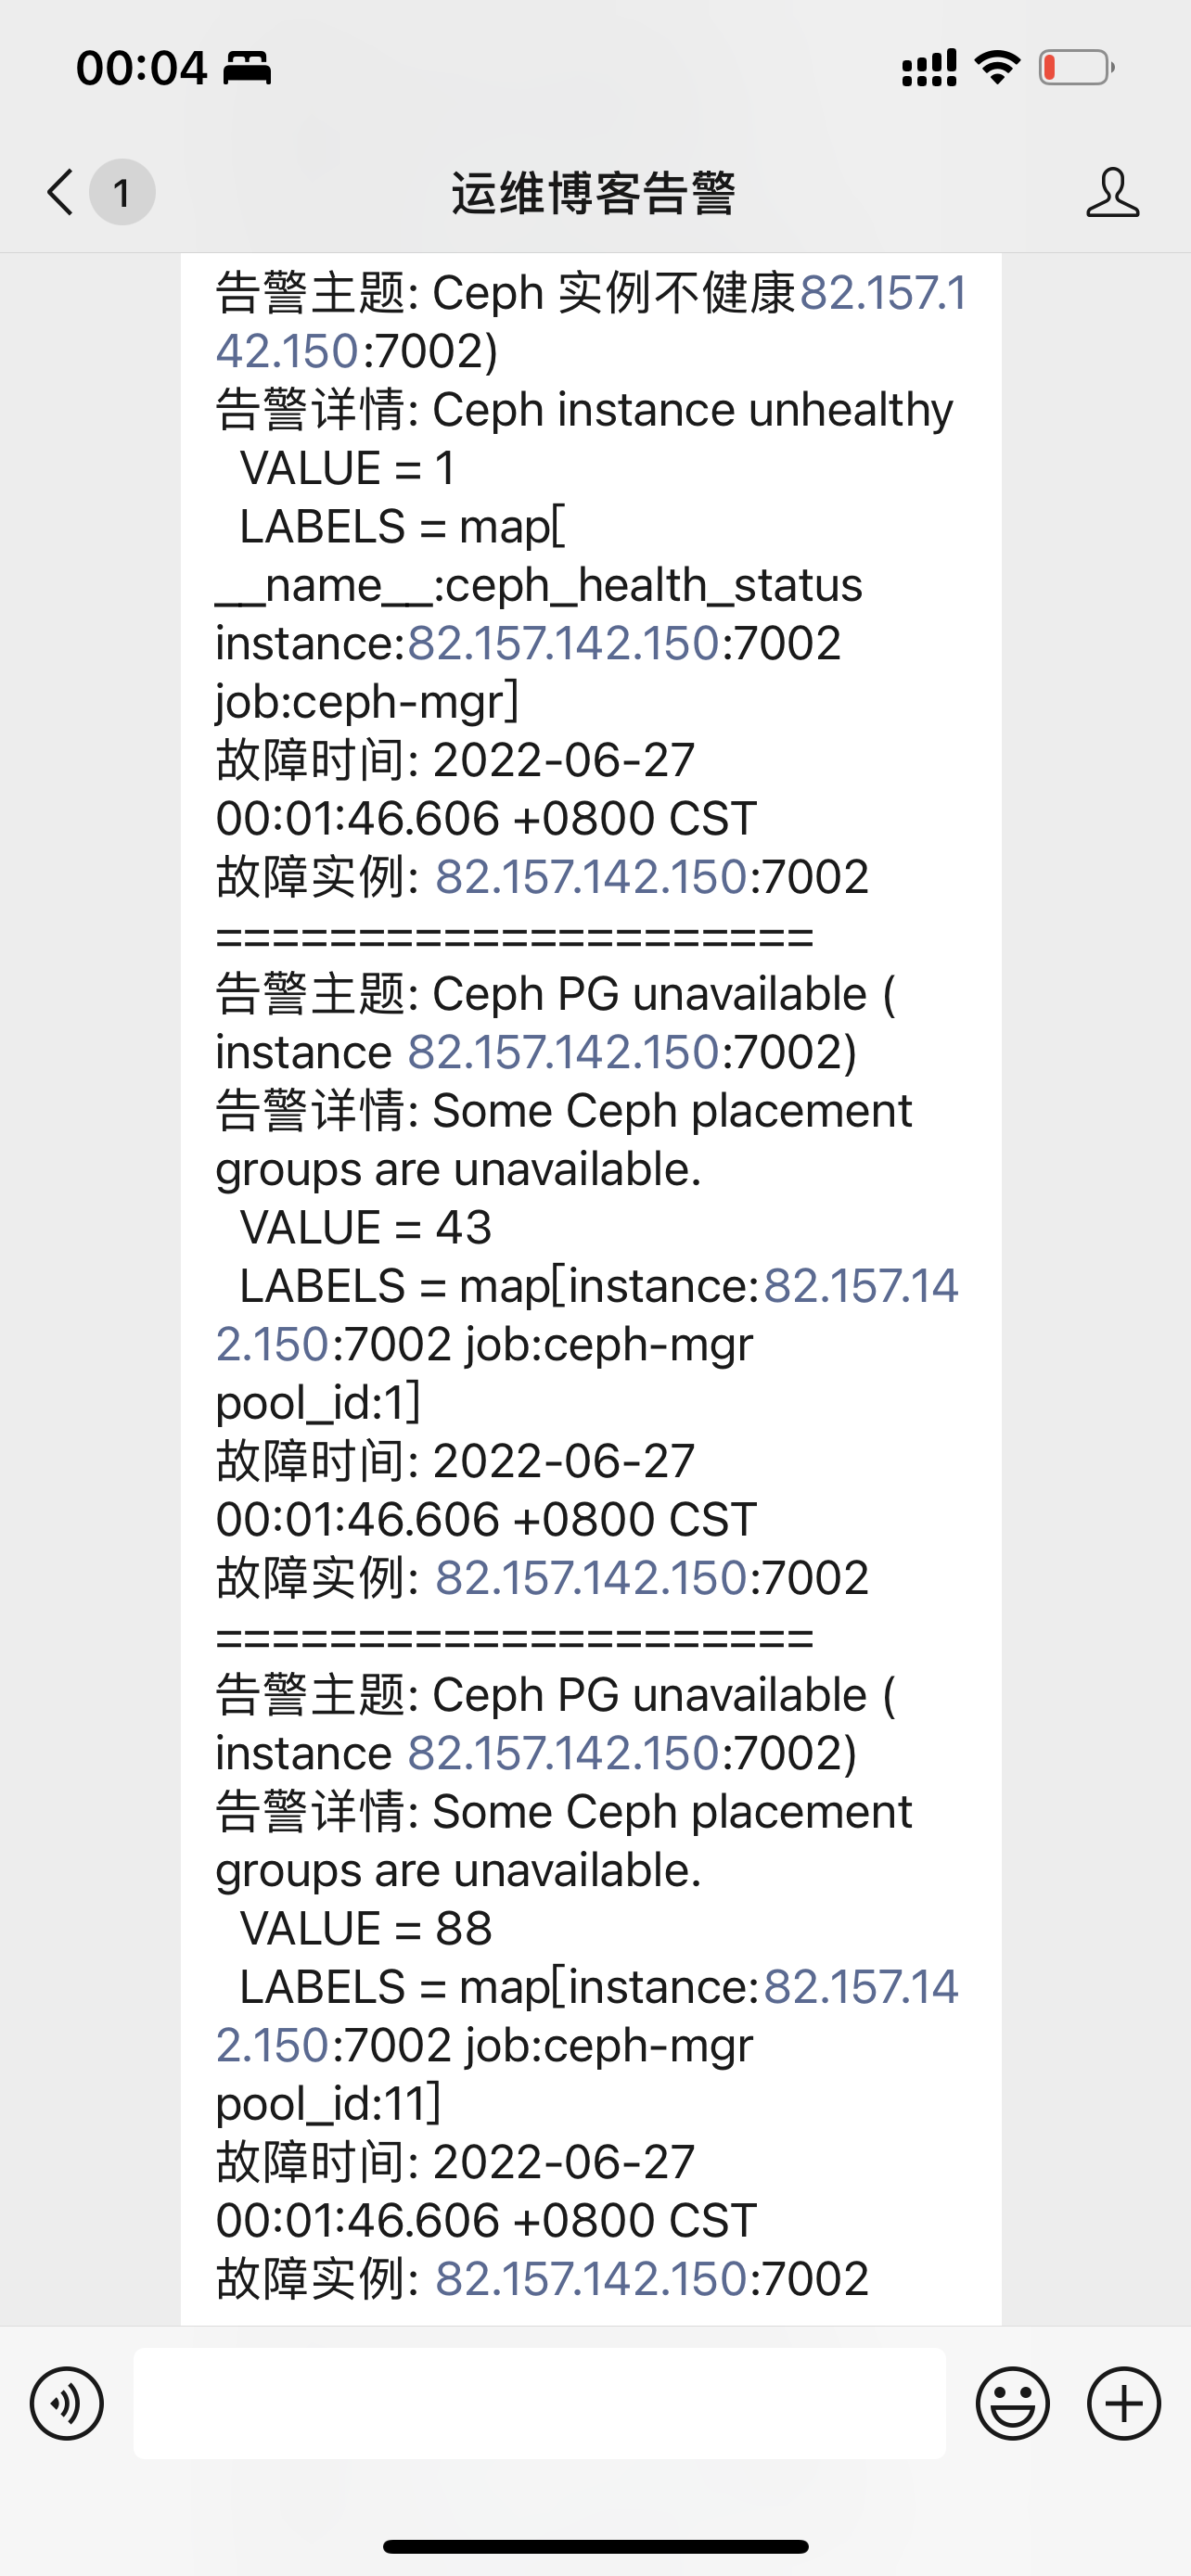
等待alertmanager发送告警内容
具体发送内容,自行优化即可


告警模板是发给企业微信的吗? 模板可不可以分享下?
[…] […]