
Nginx 通过 stub_status 页面暴露了部分监控指标。Nginx Prometheus Exporter 会采集单个 Nginx 实例指标,并将其转化为 Prometheus 可用的监控数据, 最终通过 HTTP 协议暴露给 Prometheus 服务进行采集。我们可以通过 Exporter 上报重点关注的监控指标,用于异常报警和大盘展示。
本次基于http_stub_status_module模块获取数据源
Nginx 安装
如果之前没有安装,我这里有对应脚本,直接运行即可
wget https://d.frps.cn/file/tools/nginx/nginx_install.sh
sh nginx_install.sh

#版本后续会迭代更新,本次的版本为nginx-1.22
配置stub_status
确认 stub_status 模块启用之后,修改 Nginx 的配置文件指定 status 页面的 URL
[root@ops conf.d]# cat nginx.conf
server {
  listen       80;
  server_name  localhost;
     location /nginx_status {
         stub_status;
         access_log off;
         allow 127.0.0.1;
         deny all;
     }
}
配置完毕检查
[root@ops conf.d]# curl localhost/nginx_status
Active connections: 1
server accepts handled requests
 1 1 1
Reading: 0 Writing: 1 Waiting: 0
Nginx Exporter 安装
项目地址:https://github.com/nginxinc/nginx-prometheus-exporter/releases
- Docker环境
$ docker run -p 9113:9113 nginx/nginx-prometheus-exporter:0.10.0 -nginx.scrape-uri=http://<nginx>:8080/stub_status- 宿主机环境
http://localhost:80/nginx_status 地址为Nginx status地址
#下载nginx exporter
[root@ops ~]# wget https://github.com/nginxinc/nginx-prometheus-exporter/releases/download/v0.11.0/nginx-prometheus-exporter_0.11.0_linux_amd64.tar.gz

#启动测试
[root@ops ~]# ./nginx-prometheus-exporter -nginx.scrape-uri http://localhost:80/nginx_status
NGINX Prometheus Exporter version=0.11.0 commit=e4a6810d4f0b776f7fde37fea1d84e4c7284b72a date=2022-09-07T21:09:51Z, dirty=false, arch=linux/amd64, go=go1.19
2023/06/07 14:31:35 Starting...
2023/06/07 14:31:35 Listening on :9113
2023/06/07 14:31:35 NGINX Prometheus Exporter has successfully started

#设置后台启动
[root@ops ~]# nohup ./nginx-prometheus-exporter -nginx.scrape-uri http://localhost:80/nginx_status &
检查一下metric
[root@ops ~]# curl localhost:9113/metrics
# HELP nginx_connections_accepted Accepted client connections
# TYPE nginx_connections_accepted counter
nginx_connections_accepted 4
# HELP nginx_connections_active Active client connections
# TYPE nginx_connections_active gauge
nginx_connections_active 1
# HELP nginx_connections_handled Handled client connections
# TYPE nginx_connections_handled counter
nginx_connections_handled 4
# HELP nginx_connections_reading Connections where NGINX is reading the request header
# TYPE nginx_connections_reading gauge
nginx_connections_reading 0
# HELP nginx_connections_waiting Idle client connections
# TYPE nginx_connections_waiting gauge
nginx_connections_waiting 0
# HELP nginx_connections_writing Connections where NGINX is writing the response back to the client
# TYPE nginx_connections_writing gauge
nginx_connections_writing 1
# HELP nginx_http_requests_total Total http requests
# TYPE nginx_http_requests_total counter
nginx_http_requests_total 5
# HELP nginx_up Status of the last metric scrape
# TYPE nginx_up gauge
nginx_up 1
# HELP nginxexporter_build_info Exporter build information
# TYPE nginxexporter_build_info gauge
nginxexporter_build_info{arch="linux/amd64",commit="e4a6810d4f0b776f7fde37fea1d84e4c7284b72a",date="2022-09-07T21:09:51Z",dirty="false",go="go1.19",version="0.11.0"} 1
metric相关参数值说明如下
这里的指标都是来自stub_status模块
| 名称 | 说明 | 标签 |
|---|---|---|
| nginx_connections_accepted | 已接受的客户端连接 | [] |
| nginx_connections_active | 活动的客户端连接 | [] |
| nginx_connections_handled | 处理客户端连接 | [] |
| nginx_connections_reading | NGINX 正在读取请求标头的连接 | [] |
| nginx_connections_waiting | 空闲客户端连接 | [] |
| nginx_connections_writing | NGINX 将响应写回客户端的连接 | [] |
| nginx_http_requests_total | http 请求总数 | [] |
| nginx_up | NGINX状态;1表示抓取成功, 0表示抓取失败。 | [] |
配置 Prometheus 的抓取 Job
Exporter 和 Nginx 并非共同运行,所以数据上报的 instance 并不能真实描述是哪个实例,为了方便数据的检索和观察,我们可以修改 instance 标签,使用真实的 IP 进行替换以便更加直观
  - job_name: 'abcdocker_nginx_exporter'
    static_configs:
    - targets: ['192.168.31.101:9113']
    relabel_configs:
     - source_labels: [__address__]
       regex: '.*'
       target_label: instance
       replacement: '192.168.31.101:80'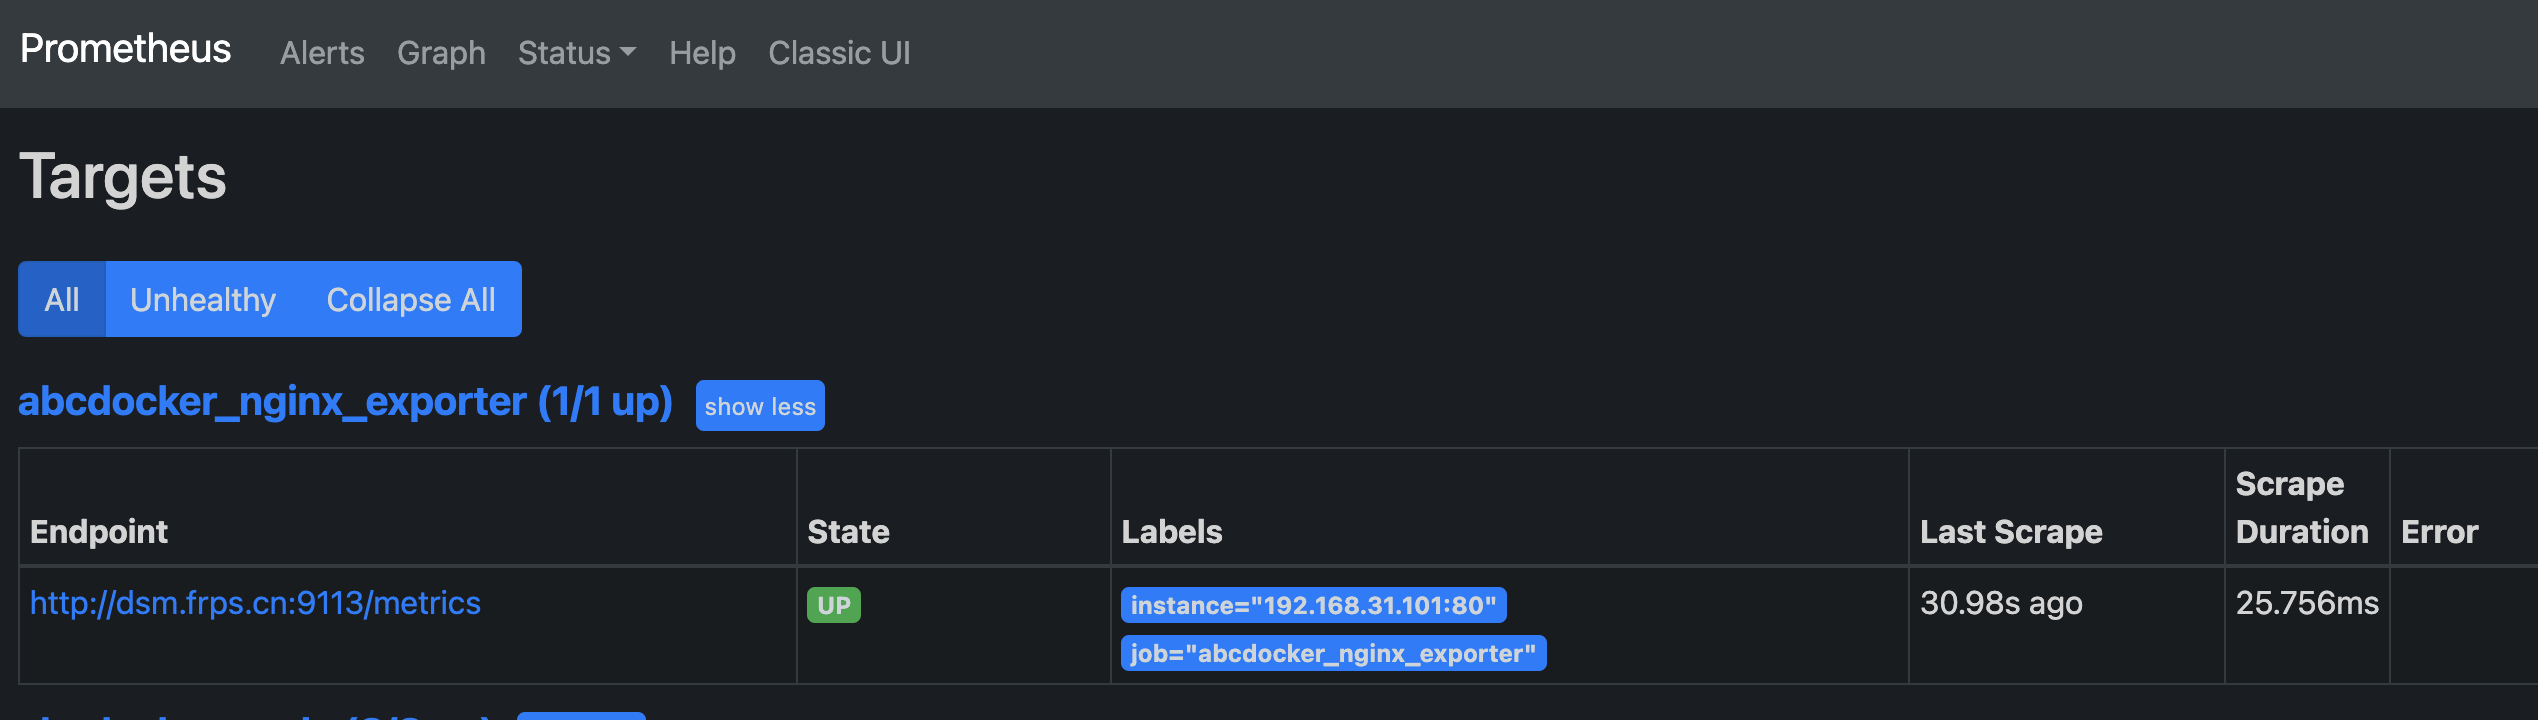
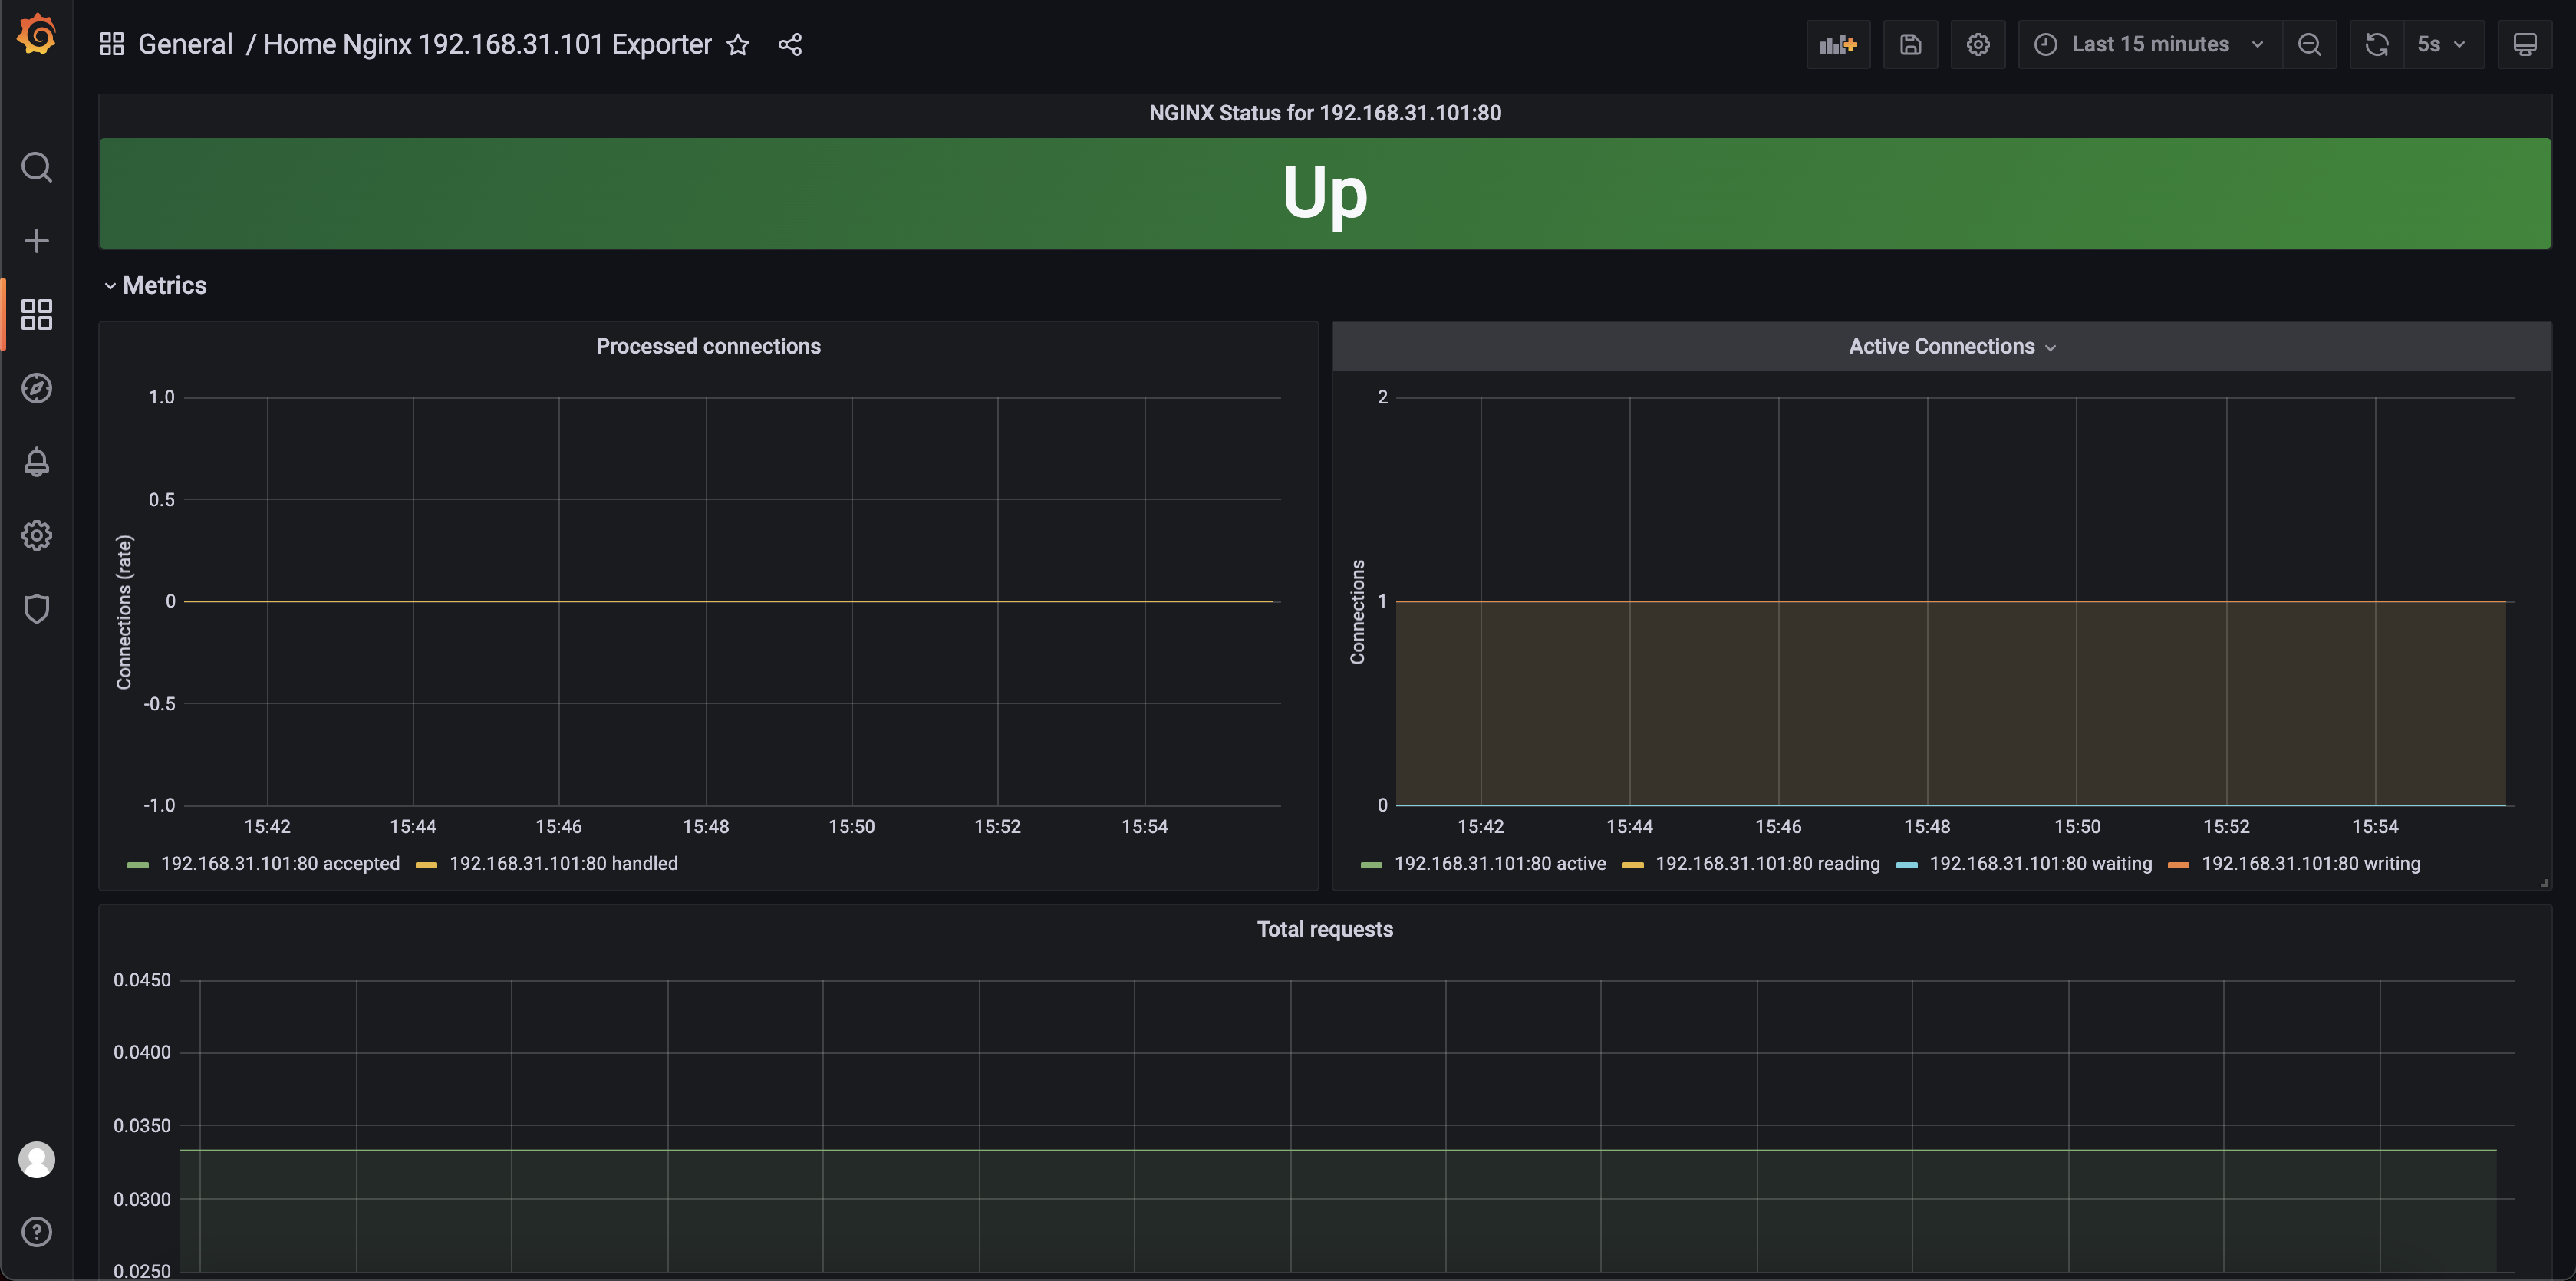
Grafana 添加
将dashboard.json下载完毕上传到Grafana中即可
https://github.com/nginxinc/nginx-prometheus-exporter/blob/main/grafana/dashboard.json
备份站:https://d.frps.cn/file/tools/nginx/nginx_exporter_dashboard.json
Alertmanager 告警
[root@prometheus ~]# cat /etc/prometheus/rules/nginx_exporter.yaml
groups:
- name: Nginx Export监控
rules:
- alert: NginxHighHttp4xxErrorRate
expr: sum(rate(nginx_http_requests_total{status=~"^4.."}[1m])) / sum(rate(nginx_http_requests_total[1m])) * 100 > 5
for: 1m
labels:
severity: critical
annotations:
summary: Nginx high HTTP 4xx error rate (instance {{ $labels.instance }})
description: "Too many HTTP requests with status 4xx (> 5%)\n VALUE = {{ $value }}\n LABELS = {{ $labels }}"
- alert: NginxHighHttp5xxErrorRate
expr: sum(rate(nginx_http_requests_total{status=~"^5.."}[1m])) / sum(rate(nginx_http_requests_total[1m])) * 100 > 5
for: 1m
labels:
severity: critical
annotations:
summary: Nginx high HTTP 5xx error rate (instance {{ $labels.instance }})
description: "Too many HTTP requests with status 5xx (> 5%)\n VALUE = {{ $value }}\n LABELS = {{ $labels }}"
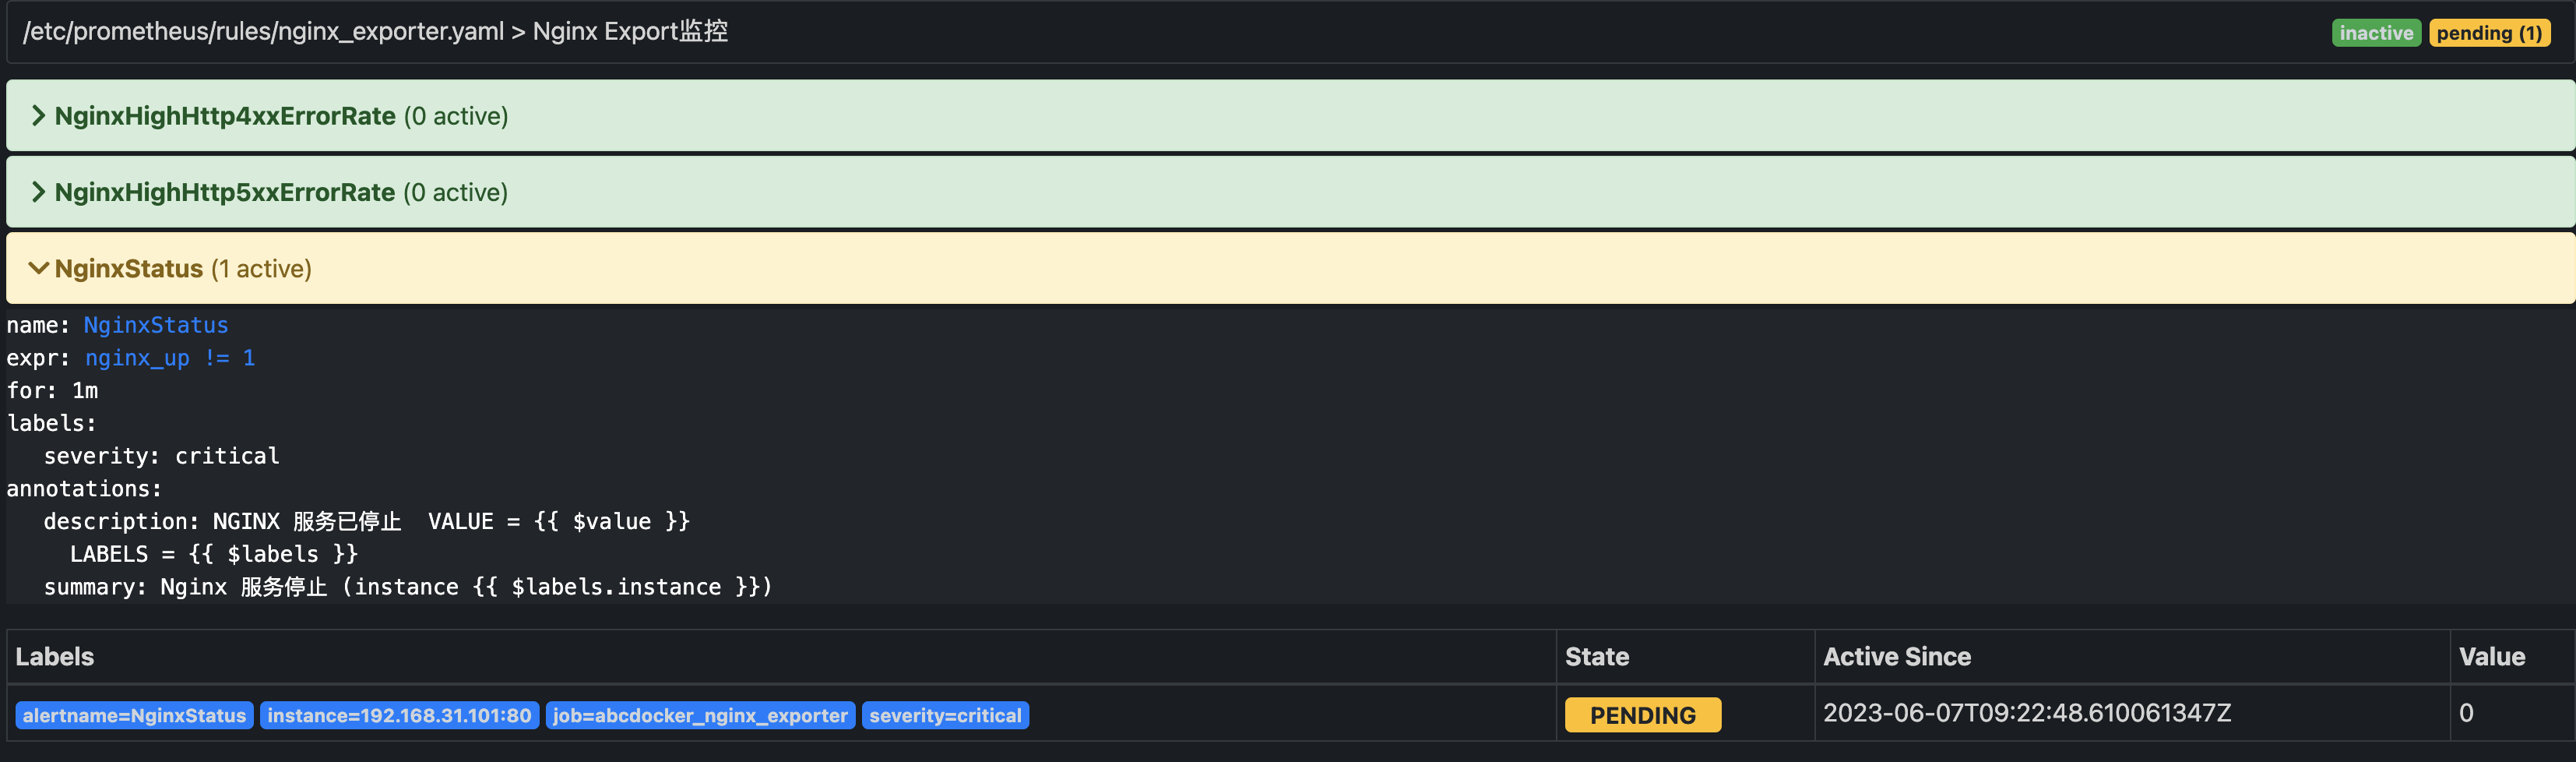
- alert: NginxStatus
expr: nginx_up != 1
for: 1m
labels:
severity: critical
annotations:
summary: Nginx 服务停止 (instance {{ $labels.instance }})
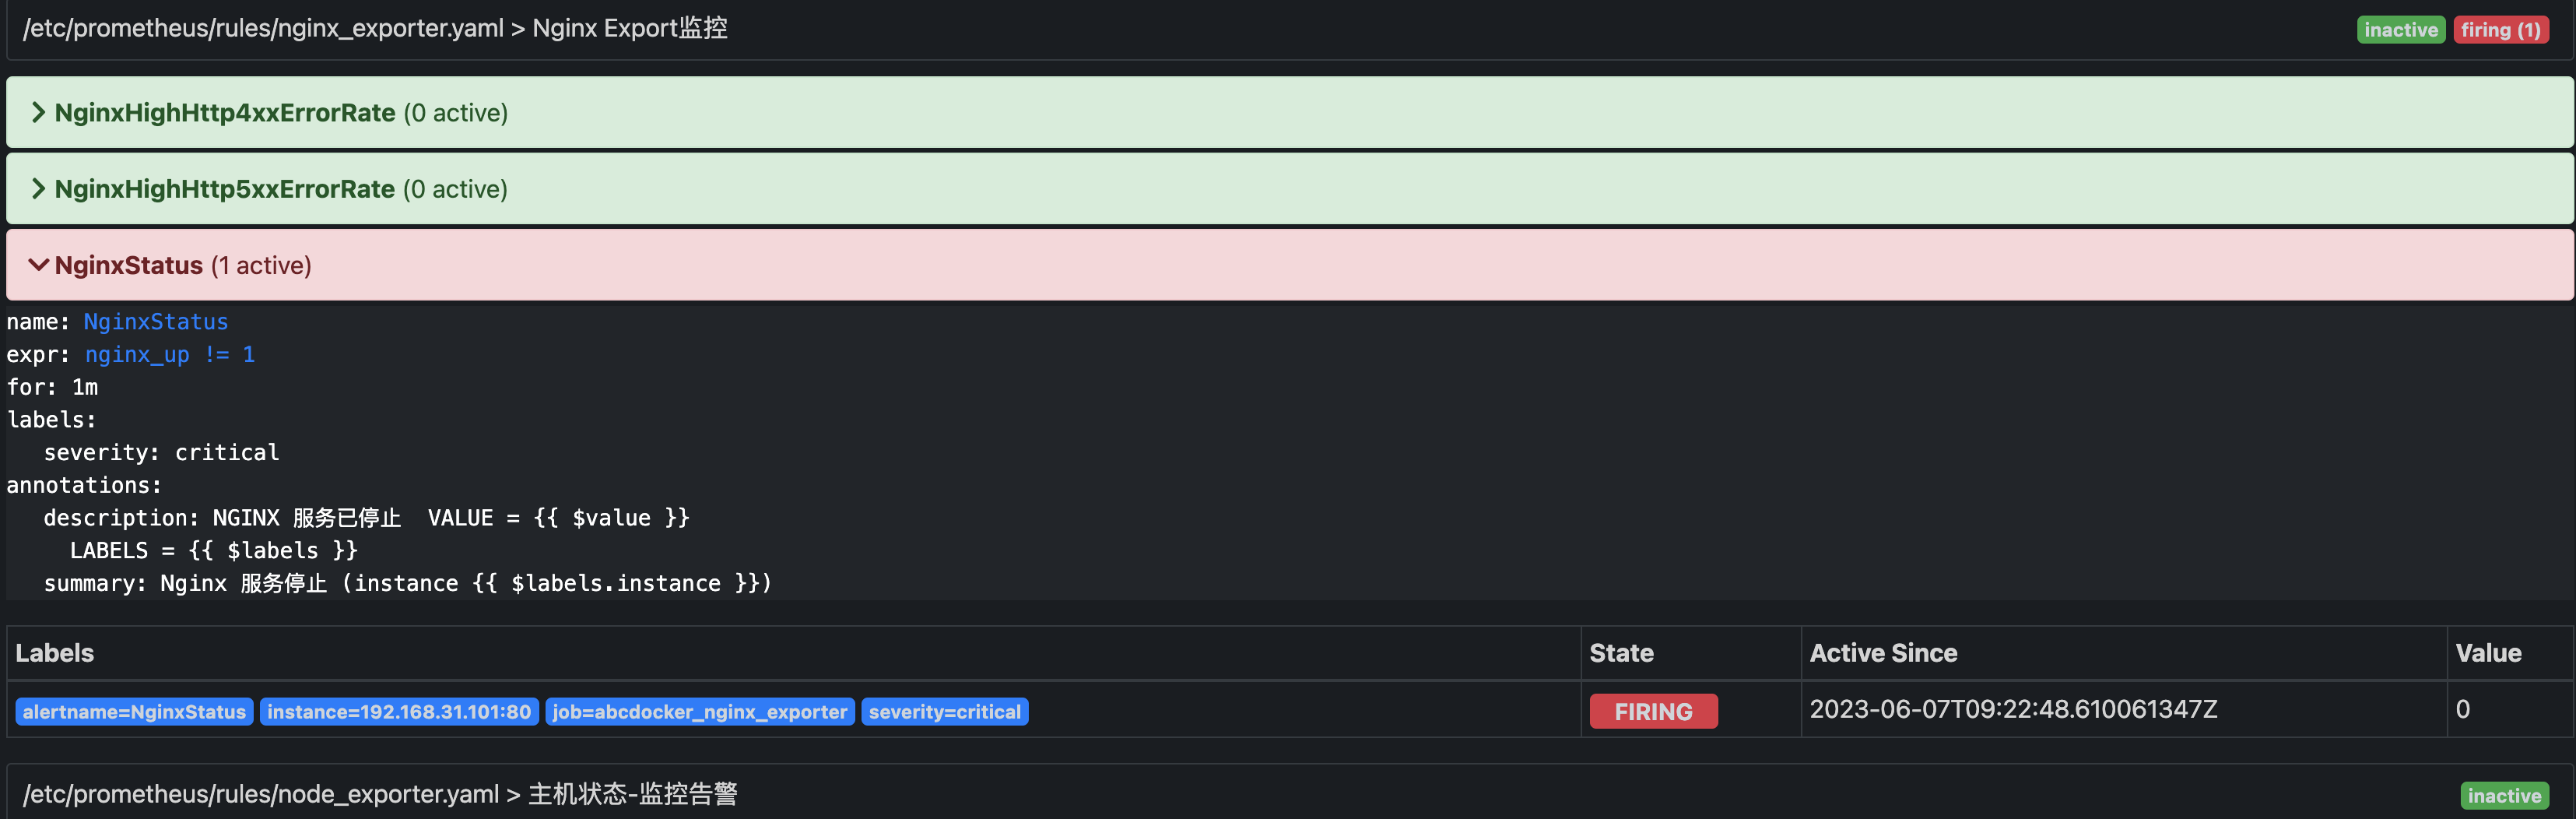
description: "NGINX 服务已停止 VALUE = {{ $value }}\n LABELS = {{ $labels }}"添加完成后,我们停止nginx做演示
效果图
**********告警通知**********
告警类型: NginxStatus
告警级别: critical
=====================
告警主题: Nginx 服务停止 (instance 192.168.31.101:80)
告警详情: NGINX 服务已停止  VALUE = 0
  LABELS = map[__name__:nginx_up instance:192.168.31.101:80 job:abcdocker_nginx_exporter]
故障时间: 2023-06-07 17:23:48.61 +0800 CST
故障实例: 192.168.31.101:80
